Happy New Year to everyone. Before Christmas we reported on the details of the forthcoming draft Local Plan. We thought the new Government approach to calculating housing need had killed off the idea of a Hartley Winchook, but it has returned like a Terminator who doesn’t understand its time has passed.
The CCH/Lib Dem coalition have included plans for a new Hartley Winchook settlement in the draft Local Plan, even though a new town is not required. There are key council meetings on the 2nd, 3rd and 4th of January 2018 to discuss these plans. We would urge as many people as possible to go along an oppose this aspect of the proposed Local Plan.
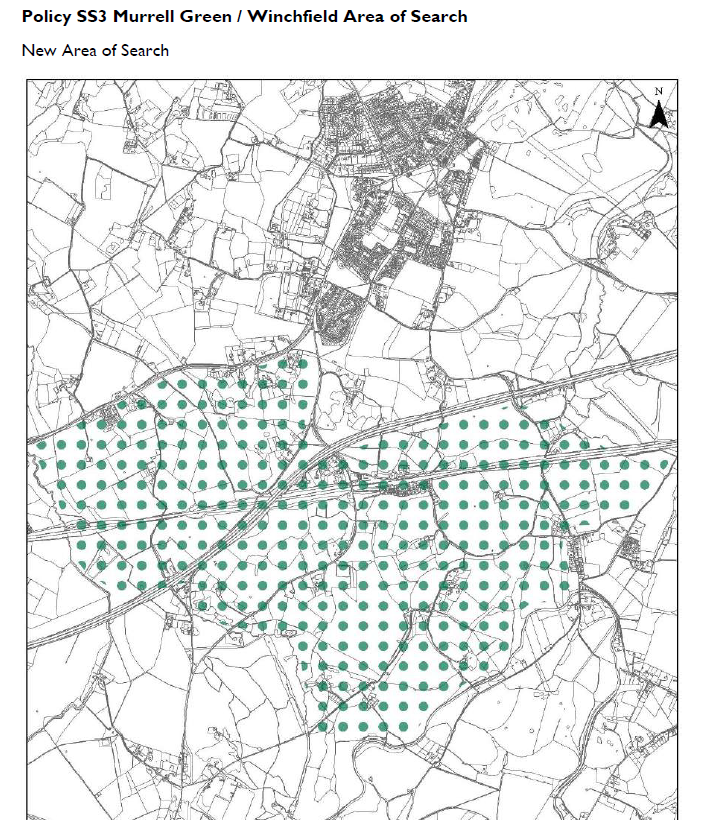
Policy SS3 Murrell Green and Winchfield Area of search for new settlement
We oppose this element of the proposed Local Plan for the following reasons:
A new town is not needed to meet the required housing numbers. The Council have set the housing target at a generous 6,208 over the planning period from 2016 to 2032. We believe this target is more than is required, but we could live with it. A new town is not required to deliver these numbers. They have identified 6,346 homes to supply this requirement, without the new town being required.
They are intending to plan for a new town that will start delivering even more new houses in 2024. This will lead to significant over-delivery of housing, unnecessarily decimating our countryside and setting an increased target for future generations.
Diverts attention away from the necessary regeneration of our urban centres of Fleet, Hook, Blackwater and Yateley.
We believe the proposal is misleading and potentially unsound because the area of search includes land that is definitely not available, for example Andrew Renshaw’s farm in Winchfield.
Unnecessarily blights the property values of residents in the area of search, which might well be illegal.
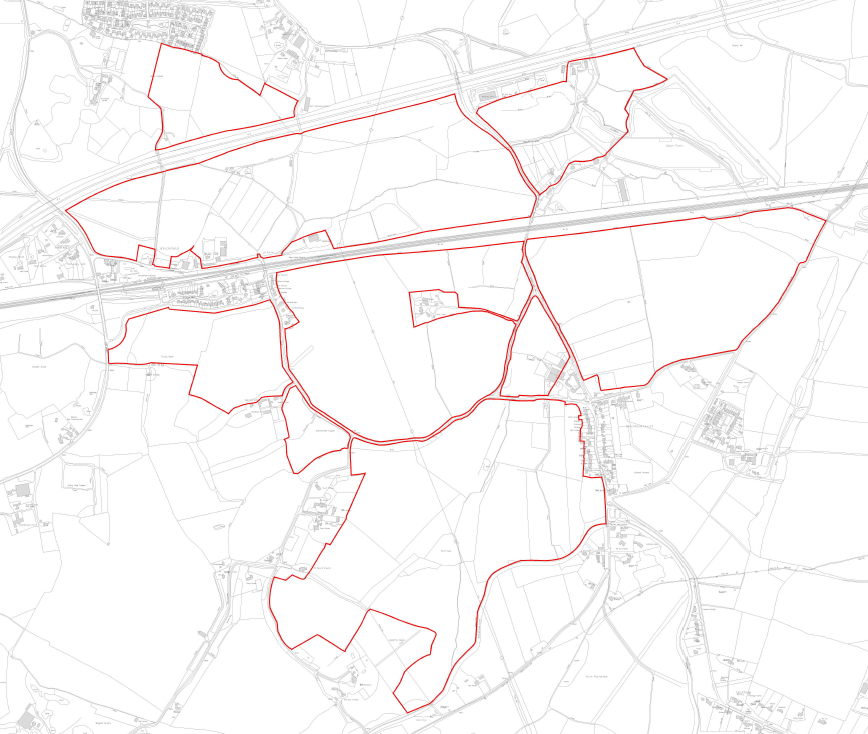
No local gaps provided around Hartley Wintney, Winchfield or to the east of Hook, (see image below).
Creates unnecessary extra work and lack of focus at this crucial stage of plan development. It is imperative that the Local Plan is approved as quickly as possible. Everybody would be able to live with the proposals if the Hartley Winchook new town plan were deleted. Including it now, adds unnecessary controversy.
Hartley Winchook leads to no strategic gaps around Hartley Wintney nor to the east of Hook
Please do go along to the following council meeting and make these arguments:
Overview and Scrutiny meeting on 2nd January at 7pm
Cabinet meeting on 3rd January at 7pm and finally,
Full Council on 4th January at 7pm
It is time to terminate this daft idea. We are sorry that we can’t be there, as we are travelling over this Christmas and New Year period.
We have been in touch with sources close to the Hart Planning team and received an update on what is intended to be published next week in the version of the Local Plan that will be used for the Regulation 19 consultation.
Here are the key bullet points:
The planning period will be changed from 2011-2032 to 2016-2032, a period of 16 years.
Hart will adopt the new Government approach to calculating housing need, but with some modification
The housing target for the new planning period will be 6,208
If all goes to plan, we won’t need a new settlement at Murrell Green or Winchfield. We also won’t need urban extensions at Pale Lane (Elvetham Chase) or Owens Farm (West of Hook).
There will be important council meetings to agree this plan on 2, 3 & 4 January, with a view to going to Regulation 19 consultation in mid-to-late January and submission to the Inspector by the end of March.
Overall, we believe this to be very good news. However, there are some risks that we will discuss below.
[Update]: We understand that the hybrid planning application for the first phase of Hartland Village has been withdrawn, and will not be heard at tonight’s planning meeting. We don’t know what impact this will have on the Local Plan outlined here. More details when we get them. [/Update]
[Update 2]: We have now heard Hartland Village might now be back on the agenda. Who knows what is happening. [/Update 2]
Hart Local Plan: new housing target
Regular readers may recall that the annual housing target for Hart in the Government consultation was 292 dwellings per annum (dpa). This was based upon 218 dpa from the raw ONS household projections, plus a market signals uplift to arrive at 292 dpa. The scale of the uplift was capped in the consultation. Hart believe this cap will be lifted to give an annual target of 310 dpa. Over the plan period this would result in a total of 4,960 new houses.
Because there is some uncertainty about the status of the consultation and whether we need to build some additional houses for Surrey Heath and/or Rushmoor, Hart believe it is prudent to uplift this target by 25% to give a planning target of 6,208.
We think this uplift is a bit too generous, but will support it, because it gives us the best chance of the plan being approved by the Inspector.
Hart Local Plan: Housing supply
We understand this housing target will be met by the following:
Built to from 2016 to 6/10/17
798
Outstanding permissions
3,048
Other deliverable
504
Other sites like to be granted
184
Odiham NP
111
Windfalls
275
Hartland Village (deliverable in plan period)
1,400
Total Supply
6,320
Eagle eyed readers will note this does not include Murrell Green, Winchfield, Pale Lane (Elvetham Chase) or Owens Farm (West of Hook).
Hart Local Plan: Risks
The big risk to this plan is Hartland Park (Pyestock). The developer has proposed only 20% affordable housing in their plan compared to Hart’s target of 40%. We understand that Hart are trying to persuade the developer to agree to periodic viability reviews. This would force the developer to be open about how much profit it is making. If it makes more money than planned, then it could be asked to build more affordable homes in the rest of the development.
If agreement on this cannot be reached, then it may not be possible to include Hartland Village in the draft Local Plan and the shortfall would have to be made up from some combination of Pale Lane (Elvetham Chase), Owens Farm (West of Hook), Murrell Green or Winchfield. We will see what happens over the coming days.
Hart Local Plan: Timetable
The finalised version of the draft Local Plan will be published on 19 December. This will be followed by:
Review by Overview and Scrutiny on 2 January 2018
Approval by Cabinet on 3 January 2018
Approval by full Council on 4 January 2018
The intention is then to move to Regulation 19 consultation in mid-to-late January for a six week period. The consultation needs to close by mid-March. This is to give enough time to make minor tweaks before submission by the end of March. This deadline is driven by Government guidelines and the Council purdah period prior to the Local elections in early May.
It is hoped that the Government will make clear its intention regarding the consultation on how to calculate housing need in January. It is also hoped that the draft NPPF is published in early January. This is to allow time for any tweaks to be made to the draft Local Plan in the light of this new information,
There are also three other documents due to be published alongside the Local Plan:
Transport Assessment
Sustainability Assessment
Habitat assessment
Conclusion
We believe the council is taking a pragmatic approach to the Local Plan, and that this approach should be supported. If we don’t support it, then the Local Plan will be delayed. This would significantly weaken the Council’s hand in relation to Pale Lane and Owens Farm.
Let’s hope this approach finds favour with councillors and we can all look forward to a Happy New Year.
Calderdale and Dorset councils have now both reduced their housing targets in the light of the Government consultation on the new way of calculating housing need. This comes hot on the heels of a similar announcement from Leeds City Council.
Despite the Government saying it was starting ‘formal intervention’ against Calderdale for not producing its Local Plan on time, the housing target has been reduced from 17,000 to 13,000. Calderdale Council has said it will be looking at further opportunities on brownfield sites and increasing densities of town centre developments. The full story can be found here.
Meanwhile, Dorset council is looking to reduce the number of homes it is planning for following the publication of the government’s consultation on a standard methodology for objectively assessed need (OAN). This story can be found here (paywall).
With at least three councils now reducing their housing target, surely it is time for Hart to follow suit. As we have reported before, Hart planned to build a ridiculous 10,185 houses in the draft Local Plan. This compares to the 8,022 in the SHMA. The new Government approach would result in 292 dwellings per annum, or 6,132 over the plan period from 2011-2032. This would be likely increased to around 6,500 once we take into account the need to build a few extra for Surrey Heath. The balance left to plan for could easily be accommodated on brownfield sites:
Sun Park (320), from Local Plan para 109
Grove Farm (423), sadly green field but given the go ahead by the inspector at appeal
The remaining 40 can come from any number of brownfield sites for instance:
Hartley Wintney (Nero Brewery – 10)
Winchfield (Winchfield Court extension – 17)
The derelict eyesores on Fleet Road – up to 200
It is time the CCH/Lib Dem coalition dropped their ridiculous new town ideology and worked to protect our valuable green fields. Sadly, there is no sign of them doing so.
Last week, we tabled six infrastructure questions to be answered at tonight’s council meeting. We found out last night that five of them won’t be answered for dubious reasons. We think this behaviour form the council is dangerously authoritarian. Our questions (in bold), Hart’s reasoning, and our response (in red) are shown below.
In essence, it seems that the CCH/Lib Dem administration does not want to face facts about school and infrastructure provision. This is frankly pathetic, and does not bode well for the quality of the next version of the Local Plan that is due to be published before Christmas, in preparation for a Cabinet meeting in early January.
Infrastructure Questions – Schools
Q1: Hampshire County Council have recently published a school places plan that shows a surplus of secondary school places up to 2021. There is now extra space for expanding Calthorpe Park. Would a new secondary school be required if the Local Plan was based on:
The 10,185 units in the draft Local Plan?
The 8,022 units in the SHMA?
The 6,132 units (or ~6,500 if Hart needs to build some extra for Surrey Heath) implied by the recent Government consultation on the approach to calculating housing need?
Notwithstanding the fact that the question is badly framed because it seeks to compare a short term School Places Plan with a much longer Local Plan which would run to 2032 (therefore there is no possibility of a genuine comparison), Hampshire County Council has a statutory duty to ensure a sufficiency of school places for Hampshire children. Therefore the hypothetical question set out in the question about the need for a secondary school should be put to Hampshire County Council as Hart District Council is not promoting a new secondary school other than working with Hampshire County Council to secure the long term availability of land for a possible future secondary school.
We are therefore rejecting the question as it relates to a matter for Hampshire County Council and also the answer will not inform any current decisions or scenarios that are being considered by Hart District Council.
The question will not be put to Council on Thursday.
Given the Government has published new guidance on how to calculate housing need, we think it is perfectly reasonable to ask questions about how that will impact school place planning. We wish that HCC had done pupil forecasting beyond 2021, but they haven’t. We were not comparing HCC’s time horizon with the Local Plan period, merely noting that up to 2021, no new secondary school is required. The purpose of the question was to find out if this would remain the case up to 2032 under a range of housing target scenarios. We think this analysis is crucial to creating a sound Local Plan.
Q2: The school places plan also shows continuing pressure on Fleet schools. Given that there is significant development proposed at Sun Park and Hartland Village, have you considered siting a new secondary school, if required, at Hartland Village or using part of the Bramshot Farm SANG?
Apparently, this question will be answered tomorrow.
Q3: HCC has also published an Infrastructure Statement showing the cost of a 150-pupil expansion of Robert Mays to be £7.6m. Scaling this up, a 9-form entry secondary school at Murrell Green or Winchfield would cost ~£68m. The expected developer funding from an 1,800 unit development with 40% affordable would be around £16m. How do you propose to fund the remaining budget for the school plus necessary the road improvements and community infrastructure?
(It will confirm that the scenario of £68m is quite unrealistic)
We have checked this source, and they are quite right, using the median estimate per pupil, a 9-form entry, 1,350 pupil school would cost around £27.3m. However, this is somewhat below Hart’s/HCC’s own assessment in July 2015, of £56-60m. So, we don’t think our £68m estimate is out of the ballpark, given it is based on more recent budget numbers for a school extension. In any event, this is not a reason to refuse to answer the question.
In any event, the question is badly framed. It is not a proper question to put to Council as it is more of a hypothetical and speculative debating point. It starts with a false premise about secondary school cost (£68m for a secondary school that is not being promoted through the emerging Local Plan) and then goes on to make uninformed speculative statements on developer funding and cost without any supporting evidence base. The suggested conclusion is not logical either. The published facts confirm that for Murrell Green for example, the development will, in addition to its own infrastructure costs, deliver 40% affordable homes, £34.5m in S106 contributions, and still leave the developer a healthy and viable surplus.
A new school was certainly being promoted in the draft Local Plan, so we feel the question is entirely reasonable. The estimate of £34.5m S106 contributions for Murrell Green is entirely new to us. We based our calculation as follows. 1,800 units in total, 40% affordable leaves 1,080 units available to make contributions, of around £14,800 per unit. At an average price of £500,000 this would mean arond 3% of revenues, or around 20% of estimated net margin of 15% of selling price. Hart’s estimate of £34.5m assumes £32,000 per unit that sounds on the high side to us.
The next version of the Local Plan at formal Regulation 19 Publication stage will show how much housing we are planning for and where it is going. The accompanying infrastructure plan to support the development proposed will be published alongside it.
The Chairman is, therefore, rejecting the question for the above reasons as we consider that the preparation of an answer to such hypothetical and speculative scenarios would require a disproportionate amount of time, money, and effort in circumstances where the work required to answer the question would not inform any decisions to be made by the Council.
We don’t think it is at all hypothetical to ask about how our infrastructure will be funded. Indeed, James Radley has recently gone on the record calling for an “infrastructure led” Local Plan, which makes our questioning even more relevant.
The question will not be put to Council on Thursday.
Infrastructure Questions – Overall Funding
Q4: The same Infrastructure Statement showed an overall funding gap of £72m for Hart. The figures don’t include healthcare, extra-care places for the elderly nor countryside services. How do you propose to quantify the un-costed items and to close the funding gap?
The question again is badly framed and fundamentally mis-quotes the purpose of Hampshire’s Infrastructure Statement. It also confuses matters that are not infrastructure funding or relevant to funding from new development.
We have not misquoted Hampshire’s document. OUr report about it, and relevant images from the document can be found here. All of the elements in our question are in Hampshire’s statement. It is entirely reasonable to ask how the funding gap will be closed, whether through development or other means.
For the record, the HCC Infrastructure Statement set out the requirements identified to support growth, but it does not attempt to set priorities with regard to funding. The Statement also specifically recognises that local authorities cannot require developers to fund existing deficiencies in infrastructure provision.
We never said it did.
In this regard, there is no expectation that development in Hart or any other District should seek to meet the overall funding gap as identified in the Infrastructure Statement (because much of the infrastructure deficit is historic) but infrastructure funding will be required to mitigate the adverse effects arising from the development itself.
We shall have to agree to disagree. When the Deputy Leader goes on the record calling for an ‘infrastructure led’ Local Plan, then it does set an expectation that our creaking infrastructure will be fixed. The reason why we have an historic funding deficit is continued mismanagement and inability to focus on getting infrastructure right. It seems by refusing to answer questions about it, the council is going to continue in the same vein. Continuing to do the same thing whilst expecting a different result is the definition of stupidity.
The next version of the Local Plan at formal Regulation 19 Publication stage will show how much housing we are planning for and where it is going. The accompanying infrastructure plan to support that development will be published alongside it.
The Chairman is, therefore, rejecting the question for the above reasons as we consider that the preparation of an answer to such hypothetical and speculative scenarios would require a disproportionate amount of time, money, and effort in circumstances where the work required to answer the question will would not inform any decisions to be made by the Council.
The question will not be put to Council on Thursday.
Infrastructure Questions – Alternative Scenarios
Q5: What is the expected incremental infrastructure funding requirement and contribution from developers if you were to construct the Local Plan based on:
The 10,185 units in the draft Local Plan?
The 8,022 units in the SHMA?
The 6,132 units (or ~6,500 if Hart needs to build some extra for Surrey Heath) implied by the recent Government consultation on the approach to calculating housing need?
This question is based upon retrospective or hypothetical scenarios that are not being advanced by the Council. These again are debating points and not a proper question to be put to Council. In any event, the next version of the Local Plan at formal Regulation 19 Publication stage will show how much housing we are planning for and where it is going. The accompanying infrastructure plan to support development in the Local Plan will be published alongside it.
These are not hypothetical scenarios. The draft Local Plan called for 10,185 new houses. THe SHMA came up with 8,022. The consequence of the new Government consultation on housing need is 6,132 units. It is perfectly reasonable to expect the council to do some strategic scenario planning to calculate the different costs and contributions to infrastructure that might be expected under each scenario and make decisions accordingly.
The Chairman is therefore, rejecting the question for the above reasons as we consider that the preparation of an answer to such hypothetical and speculative scenarios would require a disproportionate amount of time, money, and effort in circumstances where the work required to answer the question will would not inform any decisions to be made by the Council.
We asked the question because we thought they would have already done this work. It is fundamental to the decision-making process.
The question will not be put to Council on Thursday.
Pathetic.
Q6: Which of the above options would result in the lowest infrastructure funding gap?
This question is based upon hypothetical scenarios that are not being advanced by the Council. These again are debating points and not a proper question to be put to Council. In any event, the next version of the Local Plan at formal Regulation 19 Publication stage will show how much housing we are planning for and where it is going. The accompanying infrastructure plan to support the Local Plan proposals will be published alongside it.
No, it is asking for a conclusion, based on the previous question. I think we all know that we will end up with a lower infrastructure funding gap if we go with a lower housing number. The council has a duty to at the very least consider this and make decisions based on sound data and information. And we as residents should expect no less from our elected representatives.
The Chairman is, therefore, rejecting the question for the above reasons as we consider that the preparation of an answer to such hypothetical and speculative scenarios would require a disproportionate amount of time, money, and effort in circumstances where the work required to answer the question will would not inform any decisions to be made by the Council.
The question will not be put to Council on Thursday.
After the announcement of the government’s new methodology for assessing housing need, which closed for consultation two weeks ago, Leeds reviewed the plan and now proposes to leave 33 of the sites in the green belt – roughly 55% of the green belt sites originally included in the plan.
According to the city’s original local assessment of housing need, it needed 3,660 homes a year, but statistics released this week show that it only built 2,824 homes in 2016/17.
According to the government’s new methodology, however, this figure is actually higher than necessary. The government’s new assessment of housing need in Leeds is that 2,649 homes are needed every year, leading the council to scale back its development plans.
This of course begs the obvious question: If Leeds can do it, why can’t Hart?
We believe Hart’s housing target in the forthcoming Local Plan should be cut from the ridiculous 10,185 in the latest draft to a more reasonable 6,500. This would include the 6,132 from the Government consultation and allow a few hundred extra to help out Surrey Heath.
However, it seems we have new town ideologues running the council now, who won’t listen to reason.
There is no housing crisis. The housing market is adequately supplied and there is no shortage
Other than in London, rents have risen less quickly than consumer prices
House prices are high because of low interest rates and easy availability of credit
The way to reduce housing costs, if not house prices, is to increase the supply of homes for rent
More of the same tweaks to the planning system and housing market are doomed to fail.
We do hope Hart Council take notice of this article. Because carpeting out green fields with 10,185 houses isn’t going to make them any more affordable for local people. All they will do is add to the £72m infrastructure funding gap, increase waiting times at doctor’s surgeries and add to our already bad road congestion.
It is time to adopt the new Government approach to calculating Hart’s housing target so we can meet local needs and address our infrastructure problems. This will cut our housing target to around 6,500 after we make allowance to build some houses for Surrey Heath.
The article in reproduced in full below.
Lex in depth: The false promise of a UK housebuilding boom
Chancellor Philip Hammond is under pressure to commit billions of pounds to build more affordable housing. But what if a lack of houses is not the real problem?
The cost and availability of housing has become a potent political issue in the UK, where younger people especially are being priced out of the market as their parents and grandparents benefit from decades of above-inflation rises in home values.
The ruling Conservatives, traditionally the party of home ownership, now find themselves shunned by millennial voters frustrated by spiralling housing costs. So far, the response has been to provide subsidy to renters and buyers, and to exhort the construction industry to build more. Philip Hammond, the chancellor, is under pressure to announce more money for housing in Wednesday’s budget.
Yet building more homes is unlikely to meaningfully reduce prices, especially in the short term. One reason is that, whatever the other dysfunctions of the housing market there is — nationally at least — no shortage of homes.
To suggest this is to challenge a prevailing, almost universally accepted wisdom: that British house prices are high because the country has for many years failed to build enough houses. In the aftermath of the financial crisis, new home construction fell by more than a third, and even their pre-crisis levels were a far cry from the halcyon days of the 1960s or the 1930s, when completions were higher, both absolutely and relative to population.
Those on the left attribute this to the sharp fall in the construction of social housing since the 1980s. Those on the right blame the planning system for throwing sand in the wheels of the free market. Both broadly agree that the solution is to build many more homes. In 2015, ministers set a target of 1m new dwellings by 2020. On Sunday, Mr Hammond pledged to build 300,000 homes a year, though he did not specify a timeframe.
That number echoes the promise made by Harold Macmillan, housing minister in the 1951-55 Conservative government, whose achievements are hailed by those in the ruling party calling for more ambition on housing. The 1951 administration came to power on a promise to “give housing a priority second only to national defence” and presided over a construction boom in an era when austerity included food rationing.
Many prognostications about the housing market cite government data on new builds. But what matters more is the net change in overall supply, which includes property converted to residential from other uses, and subtracts the homes demolished.
The gap between these two was substantial in the Macmillan era and in the 1960s, when housebuilding was at its peak but thousands of condemned homes were also being flattened in slum clearances. It is still fairly wide today, but in the opposite direction. In the year to March 31 2017, 183,570 homes were built in England, the most since 2008. But conversions and changes of use took the total net new supply to 217,350.
All that would be academic if the supply were consistently behind demand, which at first glance does appear to be the case. In recent years, net new supply has been below the 210,000 dwellings that the government estimates will be needed each year from 2014 to 2039 in England. But long-range forecasts on household formation require big assumptions about longevity, fertility, household size and migration, and are subject to large margins of error. In 2008, the government estimated that 280,000 homes would be needed in the UK each year until 2016. In 2012, after the global financial crisis, that had dropped to 231,000 a year.
Not only are the figures a moving target — the statisticians now have to factor in the impact of Brexit on migration, for instance — but they are also some way off the reality. The 2012 forecasts predicted 27.7m households by 2016. Figures from the Office for National Statistics say there are now 27.2m households — around 500,000 fewer than predicted.
As for dwellings, there were 28m in 2014, the last year for which UK-wide figures are available. Even allowing for second homes — around 200,000 in England, down from over 300,000 a decade ago — and those that are temporarily empty, there are clearly more dwellings than there are households. That may be because there is a surplus of housing in some areas, such as old industrial towns. But Ian Mulheirn, director of consulting at Oxford Economics, says that even London and the south-east added more dwellings than households from 2001 to 2015.
One possible explanation for this contradiction is that high prices have suppressed household growth. Households cannot form because 30-year-olds are still living in their parents’ spare bedrooms. The data do not really bear out the anecdotal evidence of the “boomerang generation”. Around a quarter of people aged 20-34 still live in the parental home. In 1996, when house prices were much lower relative to earnings, the proportion was still a fifth.
But many more young people are now renting. A study by the Resolution Foundation in September found that two in five millennials (those born between 1981 and 2000) were living in private rented accommodation at the age of 30. For baby boomers (born 1946 to 1965), the equivalent figure was one in 10. Rented households are still households, but it may be that the individuals who rent together may prefer to have bought individually. The Resolution Foundation also found that, on average, renters were living in less space further from their place of work than would have been the case in the past.
Julie Rugg, a research fellow at the University of York’s Centre for Housing Policy, also cautions that national data on rents conceal wide regional variations. “There are parts of the country with housing oversupply, and where private rents may sit somewhere below social housing rents,” she says. Nevertheless, aggregate rents have risen far more slowly than aggregate prices — suggesting that high prices are about something more than just the supply and demand of homes.
For Toby Lloyd, director of housing policy at Shelter, the housing charity, that something is actually two things, “land and money”. Not just the cheap credit that followed the global financial crisis and pushed up real estate prices in cities around the world, but a whole series of policy interventions over several decades.
In Macmillan’s era, only building societies could extend mortgages, and only then on conservative terms. Liberalisation of credit and tax cuts led to the “Barber boom” of the early 1970s, where wages and prices (including house prices) rose sharply. More relaxing of credit regulation at the start of the 1980s drove an even larger expansion in lending. Mortgage securitisation facilitated further growth, as did the Basel II reforms cutting the risk weights applied to real estate. This made mortgage lending less capital-intensive for banks.
The fuelling of the housing boom
1963 Tax on imputed rents scrapped
1969 Mortgage interest relief at source (Miras) introduced
September 1971 Competition, Credit & Control Act (allows banks to borrow from wholesale market)
October 1980 Housing Act gives council tenants right to buy their homes
1988 Assured shorthold tenancies introduced, giving landlords more rights
1996 First buy-to-let mortgages sold
2000 Miras scrapped
2007 Collapse of Northern Rock and onset of financial crisis
A similar thing happened in other European countries, notably Spain and Ireland. “After about 2003 [the boom] became more about rates and money,” says Kieran McQuinn, a research professor at the Economic and Social Research Institute in Dublin. “Lots of overseas banks set up shop in Ireland. More of the buying became about investment and retirement. Even business loans were increasingly tied to property.” In the peak year for home construction, 2006, this country of just 4m people built over 90,000 homes — yet prices still rose 11 per cent that year.
The expansion of credit was only one part of what Neal Hudson, a property market analyst, calls the “financialisation of housing”. In 1963, “schedule A” personal income tax, an annual levy on the imputed rent of an owned home, was abolished. Housing profits were exempted from the new capital gains tax. In 1969 came “Miras”, a tax break on mortgage interest that endured until 2000.
Council house sales in the 1980s gave rise to a private rental market, whose development was accelerated by the reform of assured shorthold tenancies and the advent of buy-to-let mortgages in the 1990s. These came with their own advantages: landlords only paid the interest, not principal, and until this year interest costs could be offset against profit in full. More recently came the Help to Buy equity loan scheme, and increased allowances for property within inheritance tax.
Such favourable treatment of property in the legal and tax systems, and the ready availability of cheap credit and government support, did more than just nurture a long house price boom. They created behavioural effects that no econometric house price model could capture.
“People like houses as an investment because they are tangible,” says Greg Davies, a behavioural economist. “They feel they understand them far more than funds or shares or bonds. People assume that property is safe because of its familiarity.”
They may also feel that policymakers are standing behind the market. The government spends £24bn a year on housing benefit, and recently earmarked another £10bn to the Help to Buy scheme. Andrew Lilico, an economist who subscribes to the idea that there is no housing crisis, points to a key Bank of England meeting in August 2005 when, according to the minutes, “the ongoing adjustment in the housing market” was one factor that resulted in a narrow vote to cut rates to 4.5 per cent. “We took a decision to protect those who had paid too much for houses at the expense of those who wanted to buy,” says Mr Lilico.
From the mid-19th century until the start of the 1970s, the price of land moved more or less in line with the prices of homes, according to Paul Cheshire, professor of economic geography at the London School of Economics. After that, land prices tended to act as a leveraged play on house prices, with considerable volatility.
This was partly down to credit conditions. But it was also due to changes in the planning regime, especially the 1961 Land Compensation Act. This forced local authorities to pay a price for land that reflects its likely future use, rather than its current value, and gradually curtailed the involvement of local authorities in constructing new housing.
The steep rises in the value of land as it moves through the planning process are a major driver of profits for landowners and housebuilders, who have the legal expertise and financial resources to endure the often lengthy process. But the fact that land with permission to build is so costly, up to half the final selling price in some areas, is a major reason why British houses are small, poor-quality and expensive.
The existence of “green belts” around many conurbations, designed to limit further development, makes it hard for councils to approve new housing in response to local conditions. In the five years to 2017, more homes were built in Barnsley (3,480) a former mining town in South Yorkshire, than were built in booming Cambridge (2,490).
Few would dispute that building more homes is a good idea, even if aggregate data suggest there is no acute shortage. “All of the other problems become easier to solve if there are more houses to start with,” says Mr Lloyd. But few expect that building more homes to buy will reduce prices in anything but the long term — meaning over five years.
The problem for Mr Hammond is that other options are either ineffectual or politically difficult. No politician is going to turn off the credit tap. Appropriating unearned property profits from older homeowners — who in aggregate are under-occupying housing — results in howls of outrage from voters. Reforming the planning system to permanently lower the cost of development land risks incurring the wrath of voters in the leafy, prosperous counties that surround London.
Interventions such as taxing foreigners who buy UK property play well politically but have little impact. The same pattern is evident elsewhere; overseas investors buying property in Hong Kong, Singapore, Vancouver and some Australian cities pay additional stamp duty of up to 15 per cent, but such eye-watering levies have done little to stem the appetite for real estate in those cities.
Perhaps the most promising way to reduce housing costs — if not house prices — is to increase the supply of homes for rent. “The nub of the whole debate is that the market in housing assets is different from the market in housing services,” says Mr Mulheirn. “House prices do not set rents. Landlords charge what the tenant market will bear.” Yet even here, the current administration lacks the pragmatism of past ones.
Harold Macmillan encouraged private developers, but also thought nothing of mobilising the resources of the state to ensure that his target of 300,000 homes a year was met. In some of the most open markets in the world, such as Hong Kong and Singapore, the state owns most of the land and up to half the population is housed in government-owned apartments.
Some have lobbied for more state intervention. Last week Sajid Javid, the UK secretary of state for communities and local government, said he would alter the rules so that housing associations are treated as private companies and can borrow more freely. But this is a timid reform compared with the one that many academics, think tanks and even former ministers have advocated: legislating to change planning rules so that the cost of land comes down. Mr Hammond appears unmoved. His comments so far suggest the Budget will offer more of the same: relying on benefits, mortgage subsidies, tweaks to planning rules and increased private-sector construction to improve the affordability of houses to buy. Like previous attempts, it looks doomed to fail.
In total the council spent £109,858.59 on external legal and consultant costs. Astonishingly, Hart Council does not seem to track the time spent by its own staff on such matters and can’t tell us the costs incurred by internal officers. The good news is that it seems the developer did not press to be awarded its own costs of running the appeal.
However, it appears as though the council did not seek an external view on the chances of success of the appeal. We said back in December 2016 that the failure to determine the application would lead to an appeal and that Hart would likely lose the appeal.
£110,000 represents about 1% of Hart’s spending budget, and they are strapped for cash. Even though we oppose the Grove Farm development, we don’t think the council should be wasting money trying to fight lost causes.
Full FOI request on Grove Farm appeal costs
The full questions and answers (in red) are shown below:
Can you please set out the cost of defending the appeal including:
a) External legal and consultant costs: The Council holds the information that you seek. The costs were £109,858.59.
b) Internal time costs of officers. The Council does not hold the information that you seek.
c) Any potential loss of New Homes Bonus. The Council does not hold the information that you seek.
d) Lost time on the Local Plan due to resources being diverted to defend the appeal. The Council does not hold the information that you seek.
e) Appellant costs. The Council does not hold the information that you seek
Did the council receive legal advice on the chances of success in defending the appeal? The Council does not hold the information that you seek
a) What, in summary, did the advice say? The Council does not hold the information that you seek.
b) Will you make the advice public? The Council does not hold the information that you seek
c) Was the provider of this legal advice the same organisation that helped
defend the appeal? The Council does not hold the information that you seek
d) How much did the advice cost? The Council does not hold the information that you seek
Why the 10,185 ridiculous housing target is a bad idea
We challenged a number of groups who did not oppose the ridiculous housing target. This led to one of the accused groups saying we were spreading “negative waves, man”. We think it is very negative to support the 10,185 housing target, but were surprised that many did not understand the full impact. This post aims to explain why the housing target in the draft Hart Local Plan is such a bad idea.
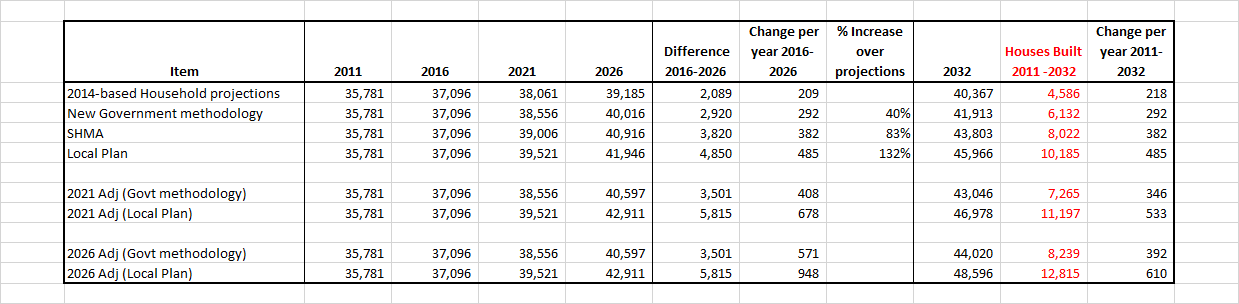
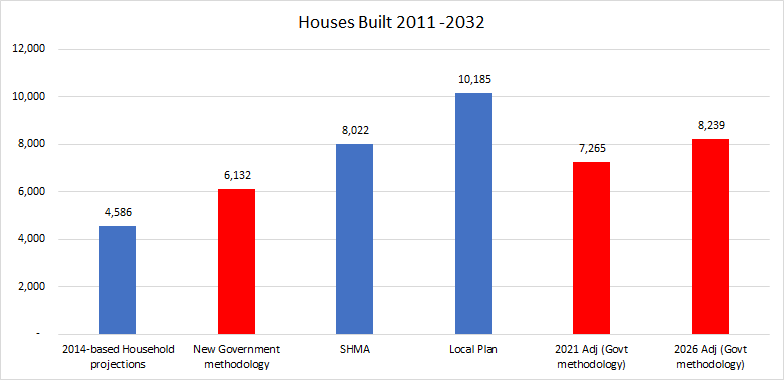
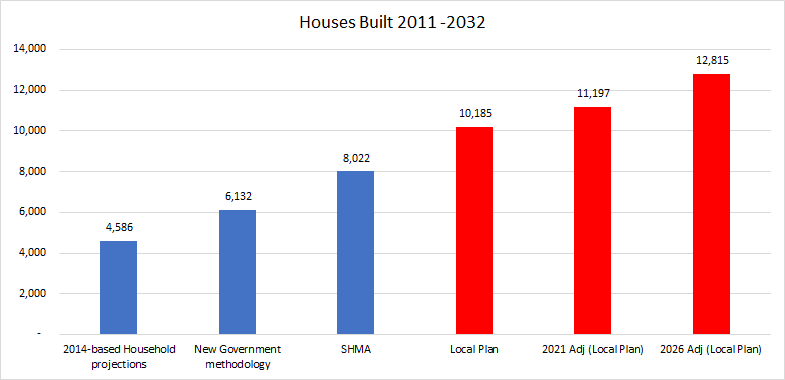
This analysis shows that, given the way Government household projections are calculated, if we continued to follow the 10,185 target in the Local Plan, the compounding effect would mean we end up building over 12,000 houses. However, if we followed the new Government methodology, we would end up building around 8,200 new houses, which could be accommodated on brownfield sites.
The only possible reason to continue with this ridiculous housing target is CCH’s ‘new town at all costs’ ideology that will end up destroying what all most love about living in Hart district.
The detailed analysis is shown below:
How are the Government household projections calculated
Data for up to 6 preceding years are used, so for the 2014-based projections trends were based on data from the years 2009 to 2014. The projections based on these trends are constrained to the assumptions made for the principal 2014-based national population projection for England.
….
The civilian population from the previous year is then aged-on, local fertility and mortality rates are applied to calculate projected numbers of births and deaths, and the population is adjusted for internal (movement between areas within England), cross-border (movements between England and the other countries of the UK), and international (movements between England and countries outside of the UK) migration.
Impact of higher migration into Hart from other districts
The impact of planning for more houses than we need is that inward migration is artificially inflated and then used in later years to inflate the future housing requirement even further. This is compounded each time the population and household projections are made. Remember also that Local Plans are supposed to be reviewed every five years and the revised household forecasts taken into account.
Hart housing target model
We have done some simple modelling to illustrate the impact of this over the plan period. This is illustrated in the data table below:
Hart housing requirement data table
The table shows four baseline numbers for 4 different scenarios:
The raw 2014-based DCLG household projections which give a total of 4,586 new houses over the plan period
The new Government methodology, using their rate of 292 per annum from 2016-2026 over the whole plan period of 2011-2032. This gives a total of 6,132.
The SHMA, which gives a total of 8,022
The ridiculous 10,185 in the draft Local Plan
The first thing to note is the draft Local Plan figure is more than twice the raw household projections. The second point to note is the figures in the new Government methodology already include a 40% ‘market signals’ uplift over the raw household forecasts. This is because Hart’s house prices are very expensive compared to local earnings.
However, these numbers are not the end of the matter, because the Local Plan has to be reviewed every five years. We have modelled what might happen in 2021 and 2026 under two scenarios. When we get to 2021, the DCLG household forecasts will look backwards at the rate of population and household growth from 2016 to 2021 and project this rate of growth forwards. Similarly, in 2026, the forecasts will project forwards the 2021-2026 rate of growth.
Hart housing requirement using new Government methodology
Under the first scenario, we have assumed that Hart builds at the rate of 292 per annum from 2016 to 2021. This rate of growth won’t have any impact on house prices, unless there is a significant recession. So, house prices will still be very high compared to earnings. Even James Radley agrees with this. Therefore, the ‘market signals’ upwards adjustment will apply again. This will inflate the required build rate. Similarly, in 2026, the 2021 build rate will then be further adjusted. This will result in a total build in the period 2011-2032 being 8,239. This is slightly more than is in the current SHMA.
Hart housing requirement using Local Plan figures
Under the second scenario, we have started with the 485 build rate in the Local Plan. We then made adjustments in 2021 and 2026 as above. The result is that the total build in the period 2011-2032 will be 12,185 units. Or 2.6 times the baseline household projections.
This is clearly an unsustainable proposition. We must reject the current Local Plan target and use the new Government figures as soon as possible. The only possible reason to continue with this ridiculous housing target is CCH’s ‘new town at all costs’ ideology that will end up destroying what all most love about living in Hart district.
We have looked at the responses from the following groups and can find no mention of their objection to the housing target:
Face IT
Fleet and Church Crookham Society
Church Crookham Parish Council
Fleet Town Council
Many of these groups strongly oppose the now withdrawn Cross Farm proposal that was included as a strategic site in the draft Local Plan. Their message seems to be: go ahead and build thousands of houses we don’t need, but don’t put them in Fleet or Church Crookham.
Councillors fail to challenge the ridiculous housing target
Community Campaign Hart CCH councillors fail to challenge the ridiculous housing target
Moreover, three Community Campaign Hart councillors have responded to the consultation without opposing the ridiculous housing target of 10,185 in the draft Local Plan:
Fewer homes at the brownfield site Hartland Village (Pyestock), which would add to pressure for green field development
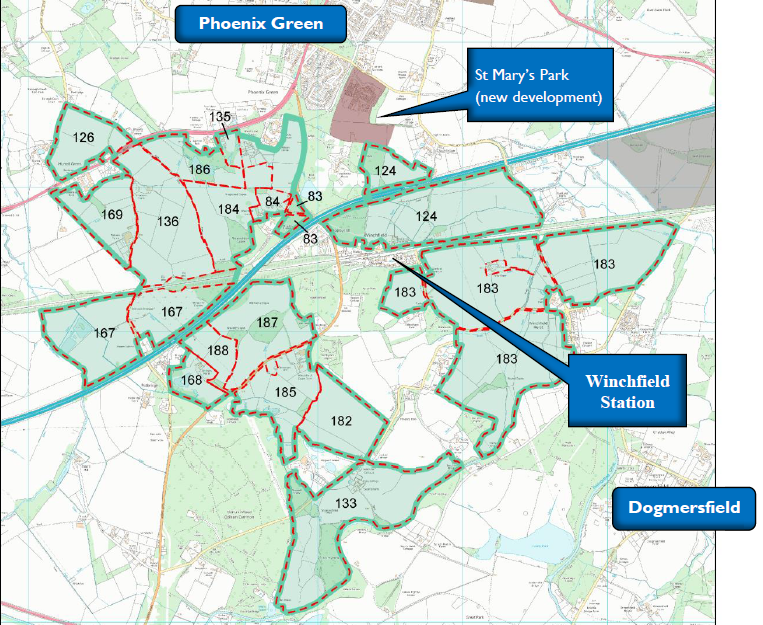
Dropping Murrell Green in favour of Winchfield East, even though the Murrell Green sites were in the area of search in the 2015 consultation (see image below) and the Winchfield East sites fared less well in testing.
Removing Cross Farm from the Local Plan. This application for this site has now been withdrawn.
No wonder they are being nicknamed Completely Concrete Hart
Area of search for Winchfield new settlement opportunity
Brian Blewett of the Liberal Democrats has also responded, supporting the position of Blackwater and Hawley Town Council and Neighbourhood Plan group. Neither of these groups opposed the housing target. As far as we can tell, Hook and Crondall Parish Councils did not oppose the housing target either.
We struggle to understand the logic of this position. We can’t understand why members who purport to stand for the good of the whole of Hart support the ridiculous uplift from the SHMA total of 8,022. The Government consultation is clear, Hart’ new housing need is going to be 6.132 units. The remaining target can be met from brownfield sites alone.
Some councillors and local groups oppose the ridiculous housing target
In better news, Andrew Renshaw, member for Hartley Wintney argued for a lower overall housing target. As did the following groups:
Crookham Village Parish Council
Dogmersfield Parish Council
Eversley Parish Council
Hartley Wintney Preservation Society
Odiham Society
Rotherwick Parish Council
Rural Hart Association
Whitewater Valley Preservation Society
Winchfield Action Group
Winchfield Parish Council
Alastair Clarke, chair of the Hart District Association of Parish and Town Councils (HDAPTC), also opposed the housing target in his personal response.
It’s great that such a diverse set of groups has seen the logic of opposing the ridiculous 10,185 housing target.
Conclusion
It is time all parishes and groups within Hart united behind the opportunity that the new Government consultation brings. This will benefit the whole of Hart and help stop the needless playing off of one parish against another.
Developers request screening opinion EIA Assessment of Winchfield New Town
Barton Willmore have submitted an application for an Environmental Impact Assessment screening opinion on Winchfield New Town (aka Garden Community). The application can be found here and searching for application number 17/02592/EIA.
As far as we can tell, the proposed site directly abuts the proposed Pale Lane (Elvetham Chase) development. The proposal is for:
2,000 new dwellings
A new secondary school
Up to 2 new primary schools
Children’s nursery
Two local/neighbourhood centres
4 Ha of employment land
Provision of Suitable Alternative Natural Greenspace
Reasons to oppose Winchfield New Town
As might be expected, we oppose this new development on number of grounds:
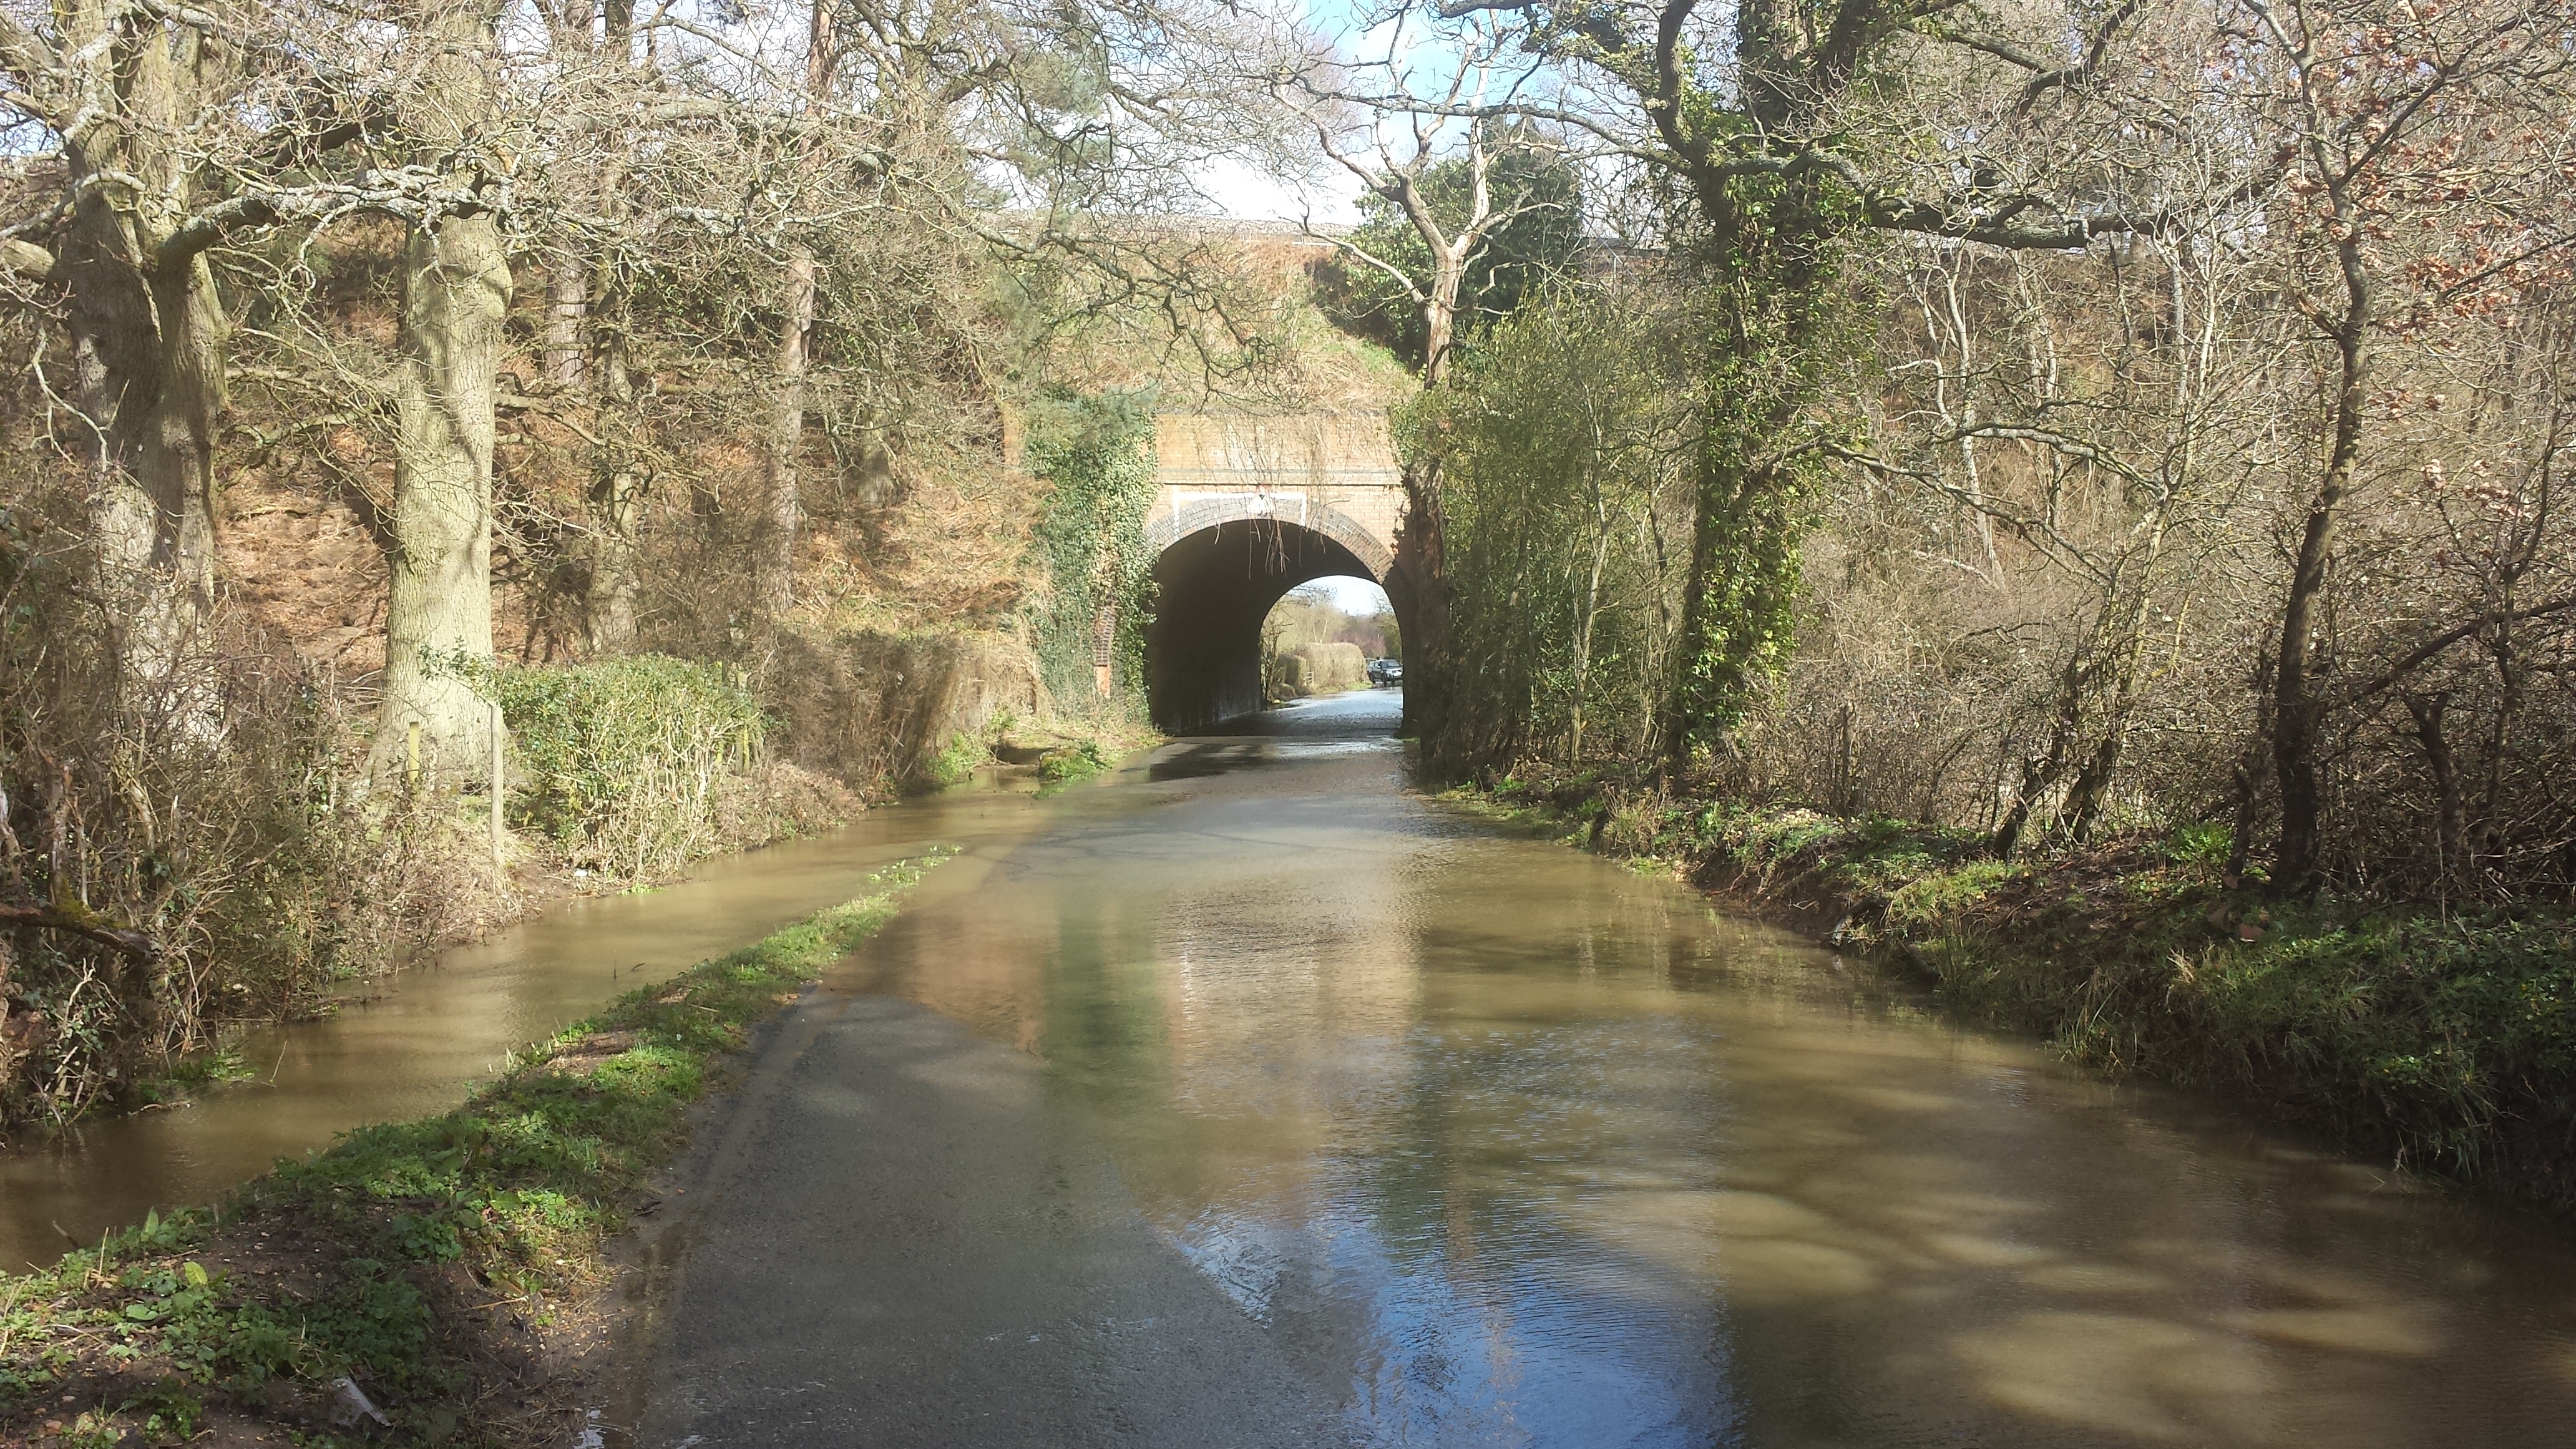
Flood Taplins Farm Lane Winchfield 28 March 2016
The site is not in the draft Local Plan, and to change the Local Plan so significantly would require another round of consultation and more delay, putting at risk other sensitive sites such as Pale Lane and West Hook.
Development of this scale is simply not required. The new Government approach to calculating housing needs would result in 6,132 new houses for Hart compared to the unnecessary and ridiculous 10,185 in the draft Local Plan.