
Why the 10,185 ridiculous housing target is a bad idea
We challenged a number of groups who did not oppose the ridiculous housing target. This led to one of the accused groups saying we were spreading “negative waves, man”. We think it is very negative to support the 10,185 housing target, but were surprised that many did not understand the full impact. This post aims to explain why the housing target in the draft Hart Local Plan is such a bad idea.
This analysis shows that, given the way Government household projections are calculated, if we continued to follow the 10,185 target in the Local Plan, the compounding effect would mean we end up building over 12,000 houses. However, if we followed the new Government methodology, we would end up building around 8,200 new houses, which could be accommodated on brownfield sites.
The only possible reason to continue with this ridiculous housing target is CCH’s ‘new town at all costs’ ideology that will end up destroying what all most love about living in Hart district.
The detailed analysis is shown below:
How are the Government household projections calculated
The primary driver of household projections is the ONS population forecast.
Methodology for calculating DCLG household projections
The sub-national population forecasts are in turn calculated as follows (emphasis mine):
Data for up to 6 preceding years are used, so for the 2014-based projections trends were based on data from the years 2009 to 2014. The projections based on these trends are constrained to the assumptions made for the principal 2014-based national population projection for England.
….
The civilian population from the previous year is then aged-on, local fertility and mortality rates are applied to calculate projected numbers of births and deaths, and the population is adjusted for internal (movement between areas within England), cross-border (movements between England and the other countries of the UK), and international (movements between England and countries outside of the UK) migration.
Impact of higher migration into Hart from other districts
We know that the SHMA is already planning for more houses than we need, and the SHMA itself acknowledges that these extra people will come from other districts. Hart have then compounded this problem by planning for 2,000 more houses than the SHMA calls for.
The impact of planning for more houses than we need is that inward migration is artificially inflated and then used in later years to inflate the future housing requirement even further. This is compounded each time the population and household projections are made. Remember also that Local Plans are supposed to be reviewed every five years and the revised household forecasts taken into account.
Hart housing target model
We have done some simple modelling to illustrate the impact of this over the plan period. This is illustrated in the data table below:
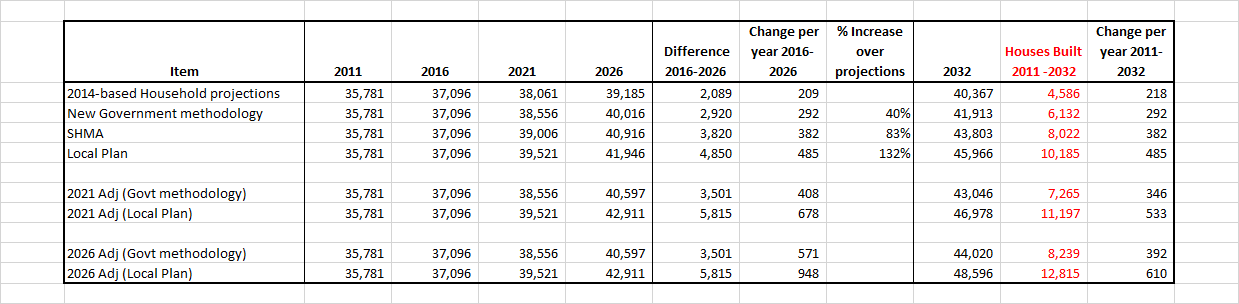
Hart housing requirement data table
The table shows four baseline numbers for 4 different scenarios:
- The raw 2014-based DCLG household projections which give a total of 4,586 new houses over the plan period
- The new Government methodology, using their rate of 292 per annum from 2016-2026 over the whole plan period of 2011-2032. This gives a total of 6,132.
- The SHMA, which gives a total of 8,022
- The ridiculous 10,185 in the draft Local Plan
The first thing to note is the draft Local Plan figure is more than twice the raw household projections. The second point to note is the figures in the new Government methodology already include a 40% ‘market signals’ uplift over the raw household forecasts. This is because Hart’s house prices are very expensive compared to local earnings.
However, these numbers are not the end of the matter, because the Local Plan has to be reviewed every five years. We have modelled what might happen in 2021 and 2026 under two scenarios. When we get to 2021, the DCLG household forecasts will look backwards at the rate of population and household growth from 2016 to 2021 and project this rate of growth forwards. Similarly, in 2026, the forecasts will project forwards the 2021-2026 rate of growth.
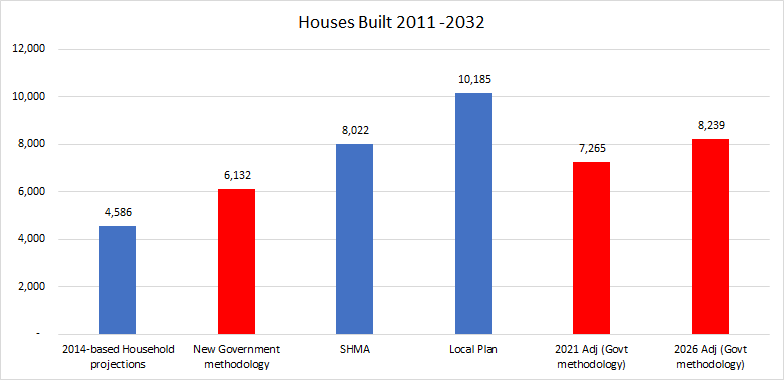
Hart housing requirement using new Government methodology
Under the first scenario, we have assumed that Hart builds at the rate of 292 per annum from 2016 to 2021. This rate of growth won’t have any impact on house prices, unless there is a significant recession. So, house prices will still be very high compared to earnings. Even James Radley agrees with this. Therefore, the ‘market signals’ upwards adjustment will apply again. This will inflate the required build rate. Similarly, in 2026, the 2021 build rate will then be further adjusted. This will result in a total build in the period 2011-2032 being 8,239. This is slightly more than is in the current SHMA.
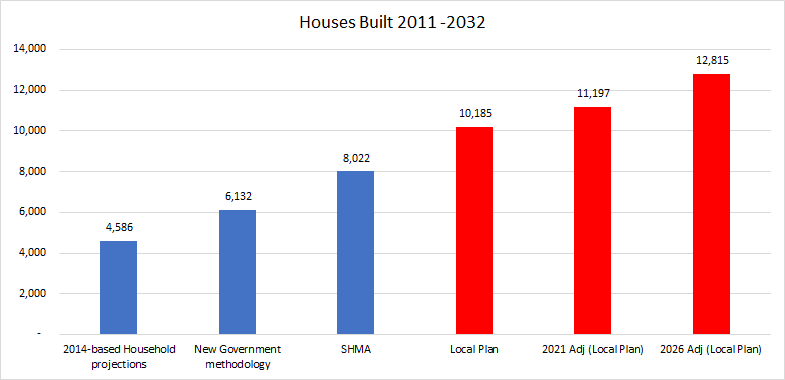
Hart housing requirement using Local Plan figures
Under the second scenario, we have started with the 485 build rate in the Local Plan. We then made adjustments in 2021 and 2026 as above. The result is that the total build in the period 2011-2032 will be 12,185 units. Or 2.6 times the baseline household projections.
This is clearly an unsustainable proposition. We must reject the current Local Plan target and use the new Government figures as soon as possible. The only possible reason to continue with this ridiculous housing target is CCH’s ‘new town at all costs’ ideology that will end up destroying what all most love about living in Hart district.
Pingback: CCH reveal plan to Completely Concrete Hart | We Heart Hart