Floods in Winchfield, Hartley Wintney, Hook and Crookham Village cast doubt on new town plan

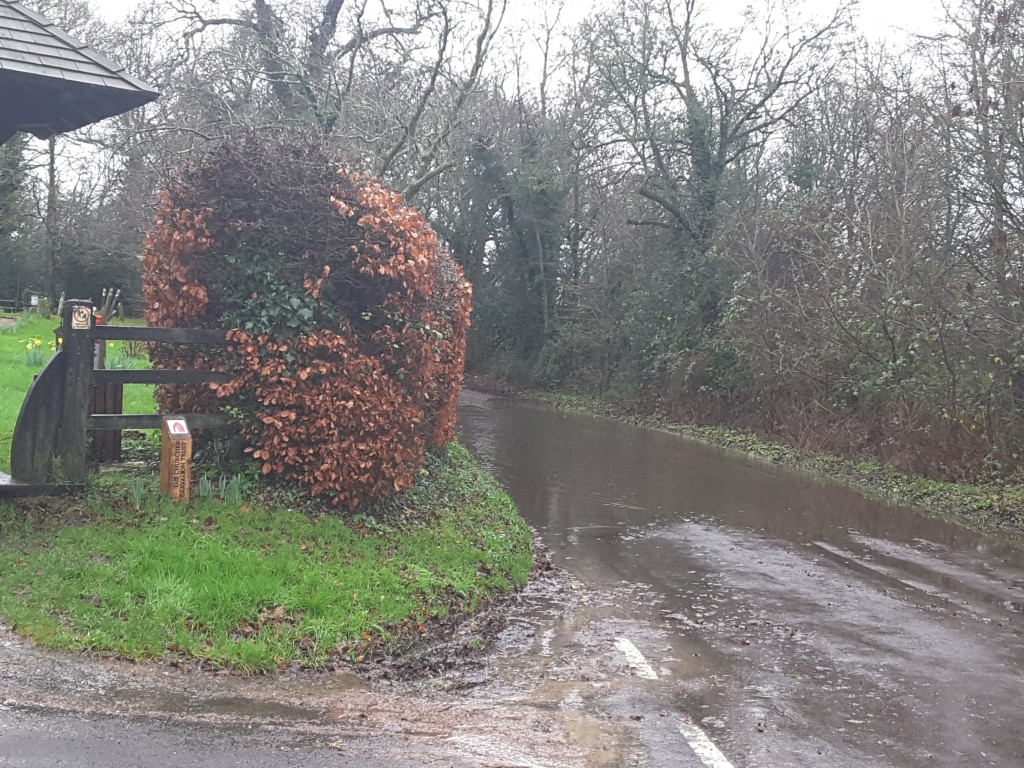
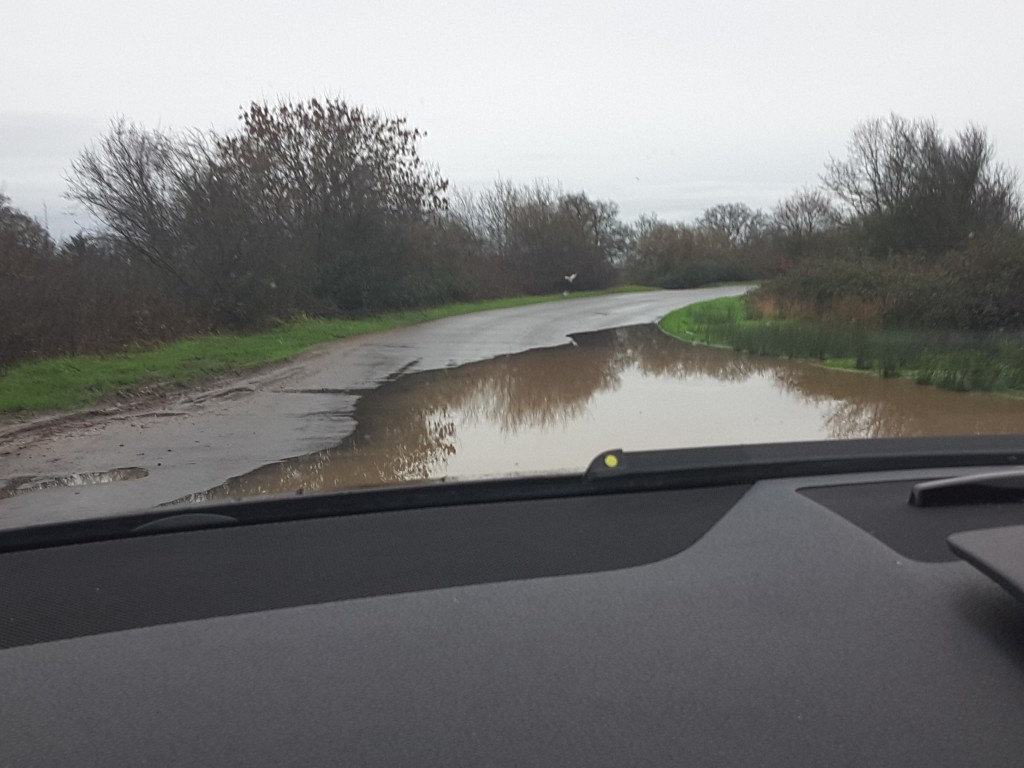
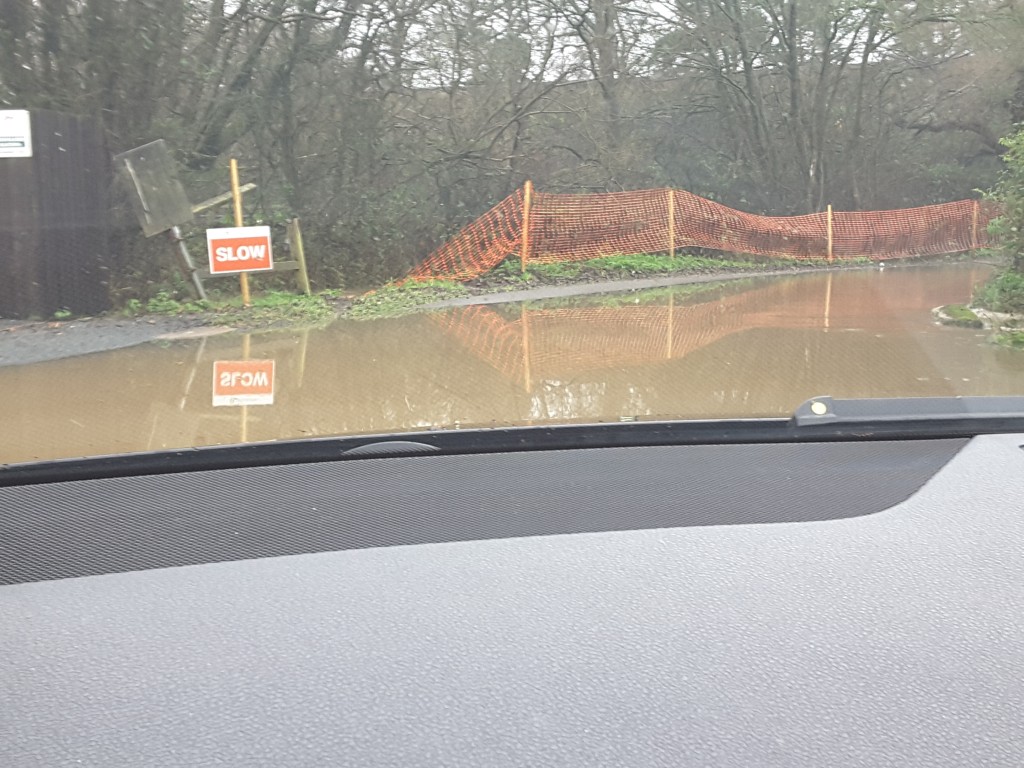
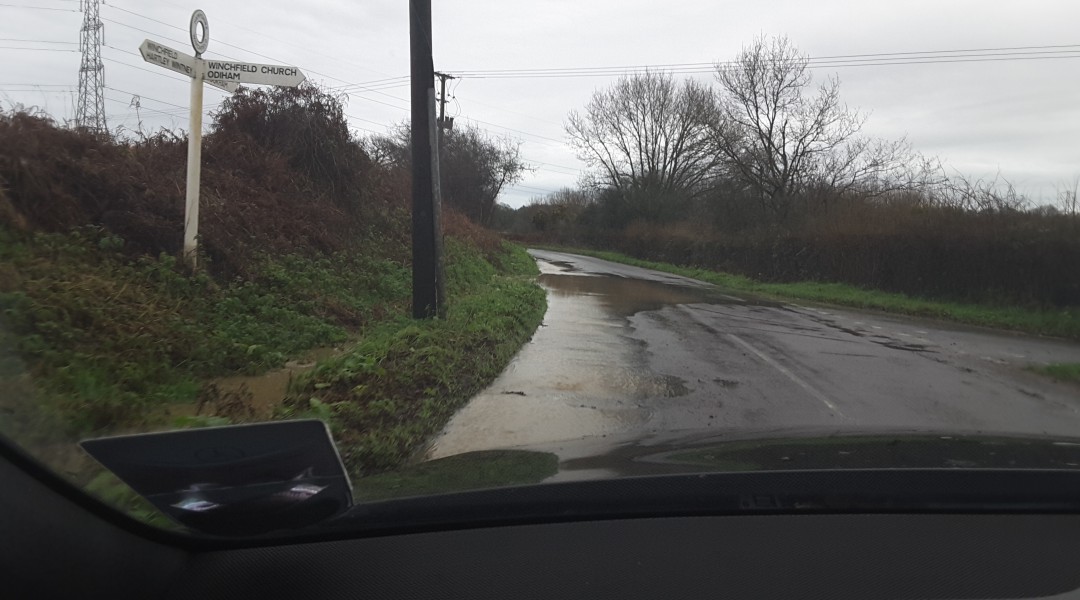
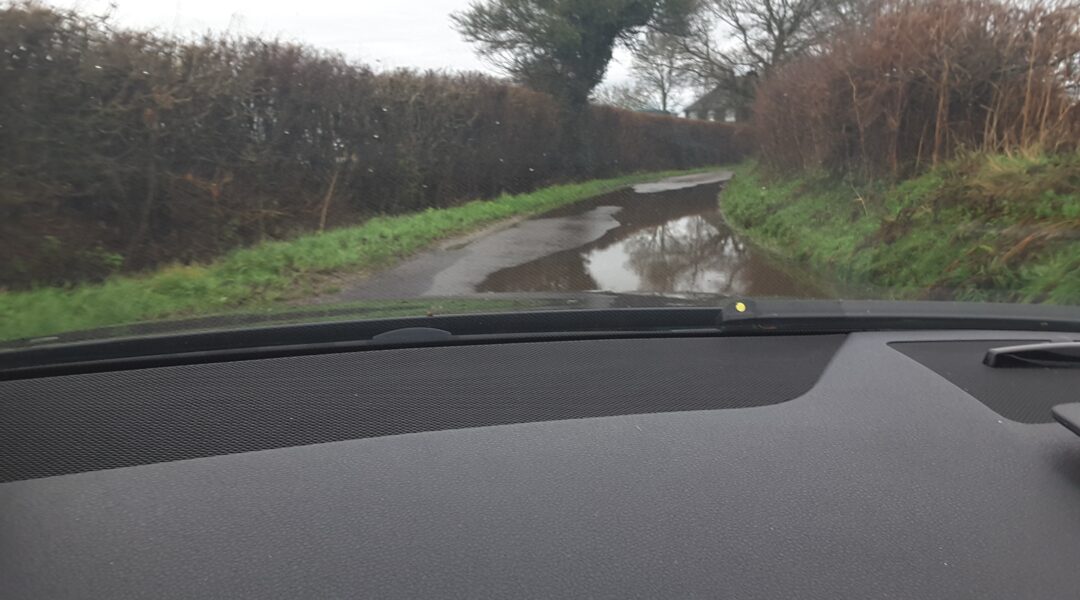
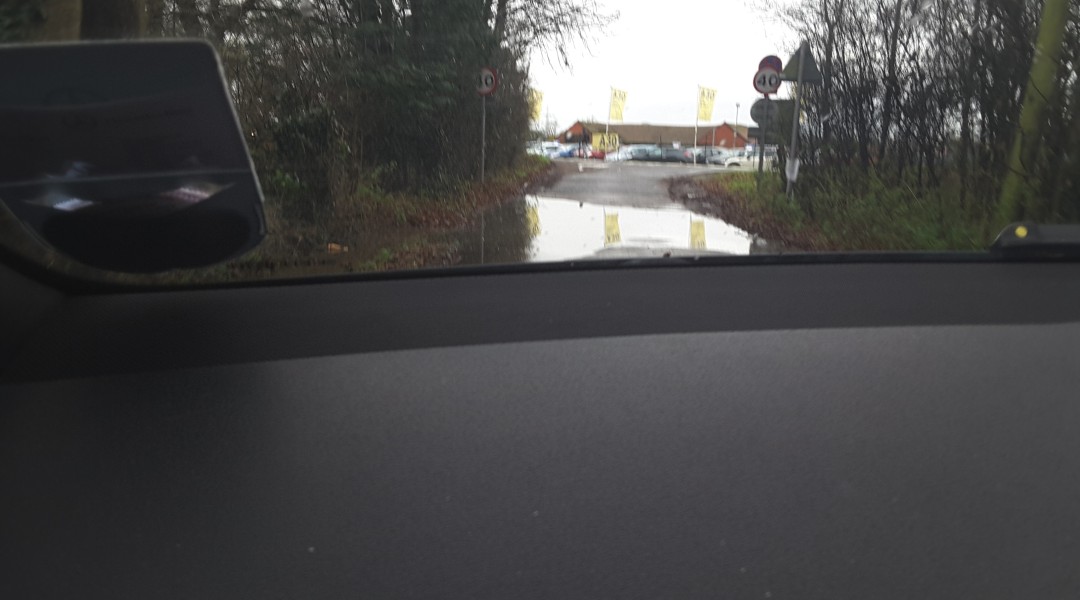
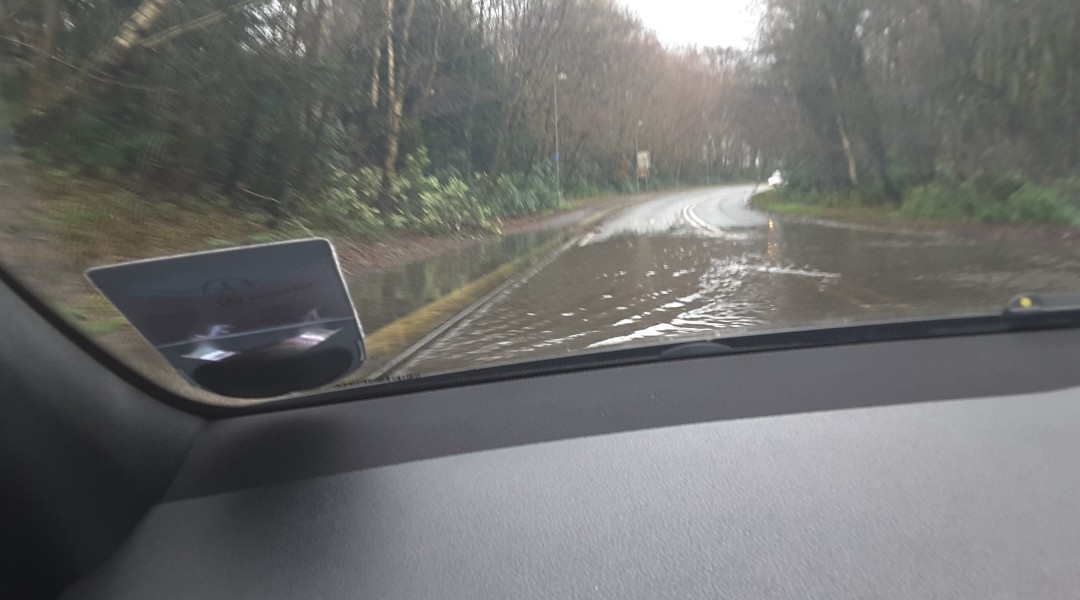
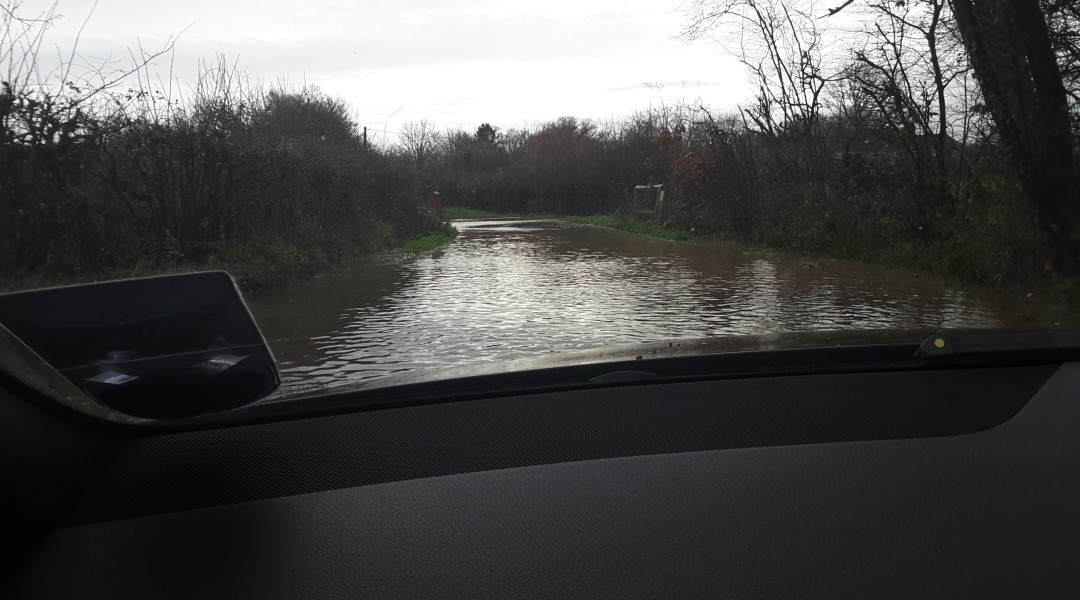
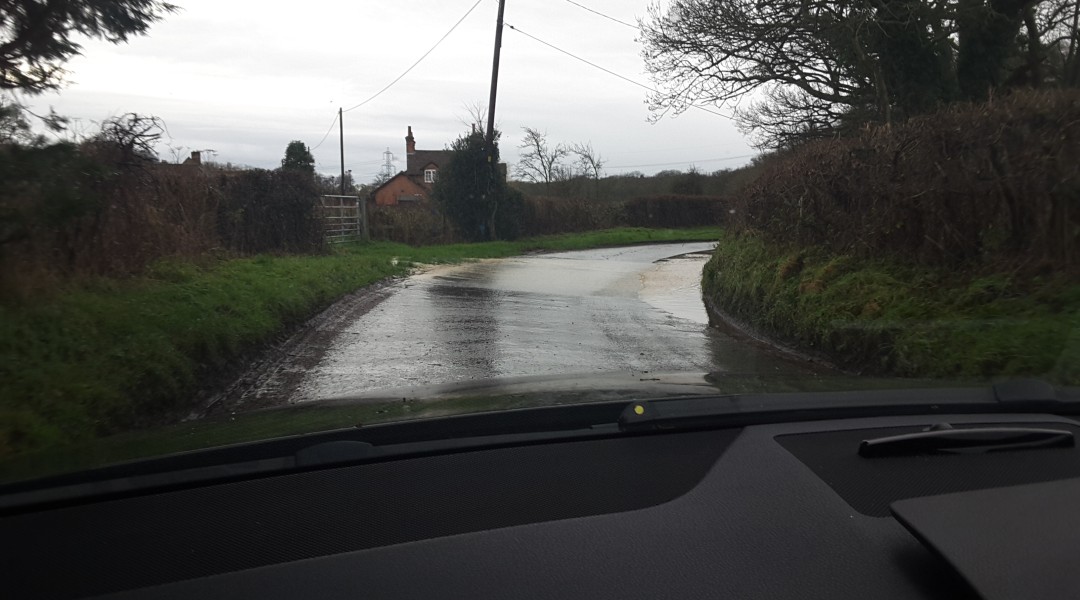
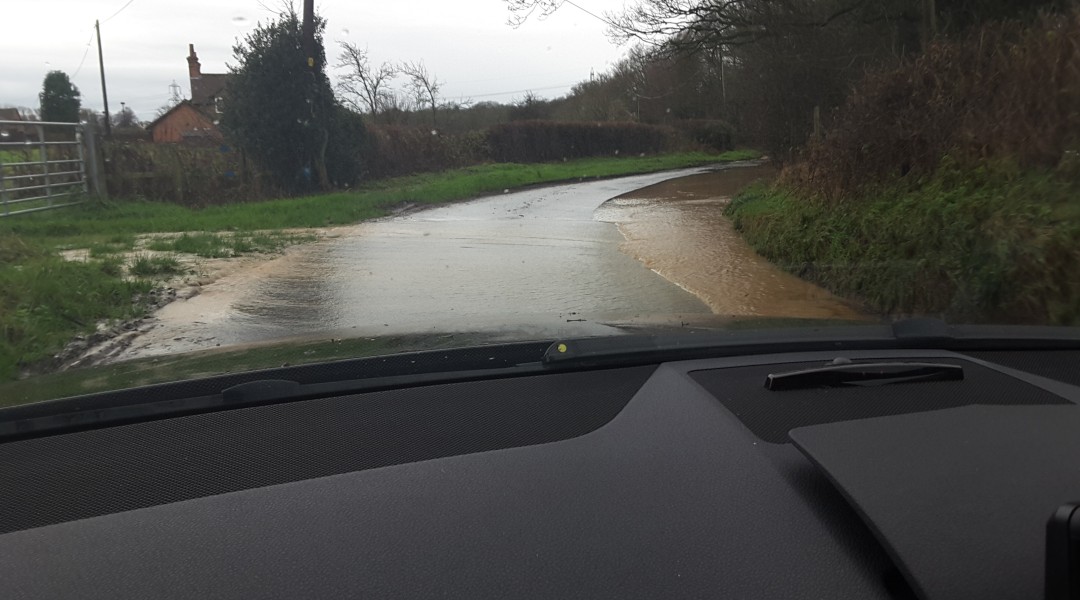
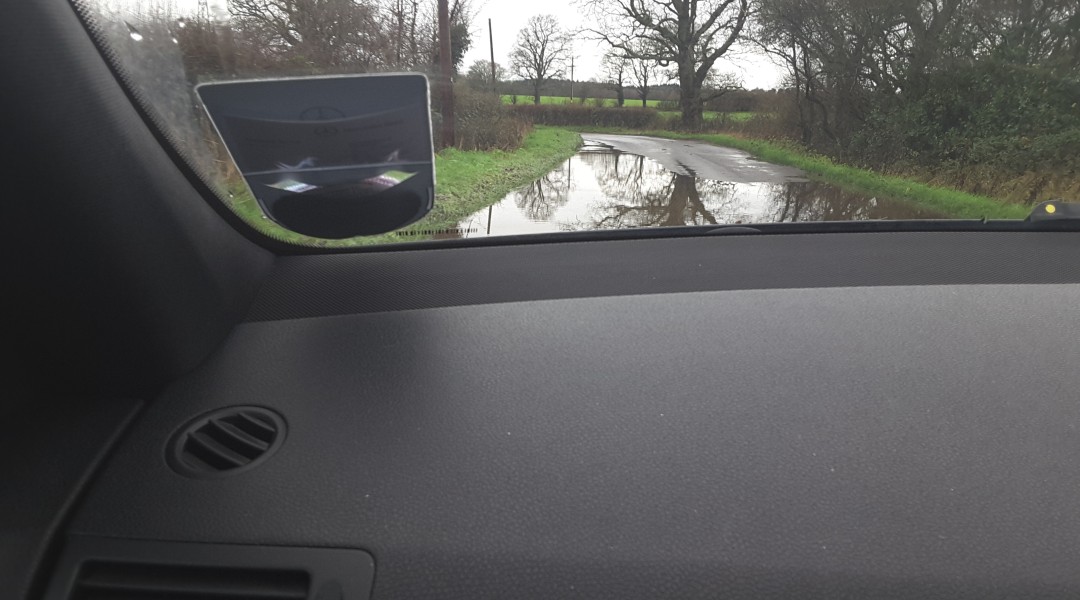
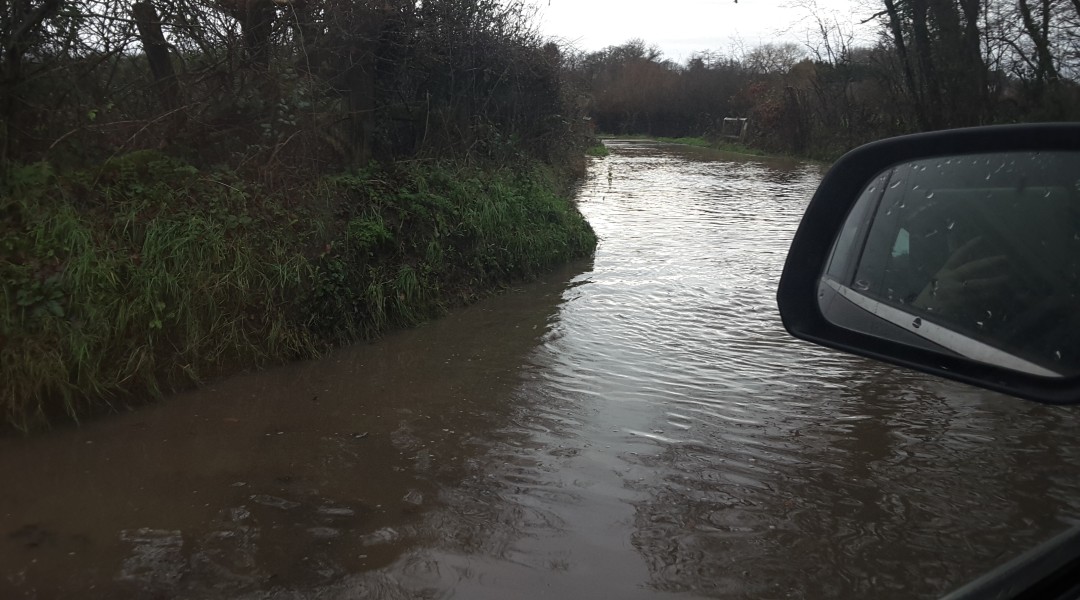
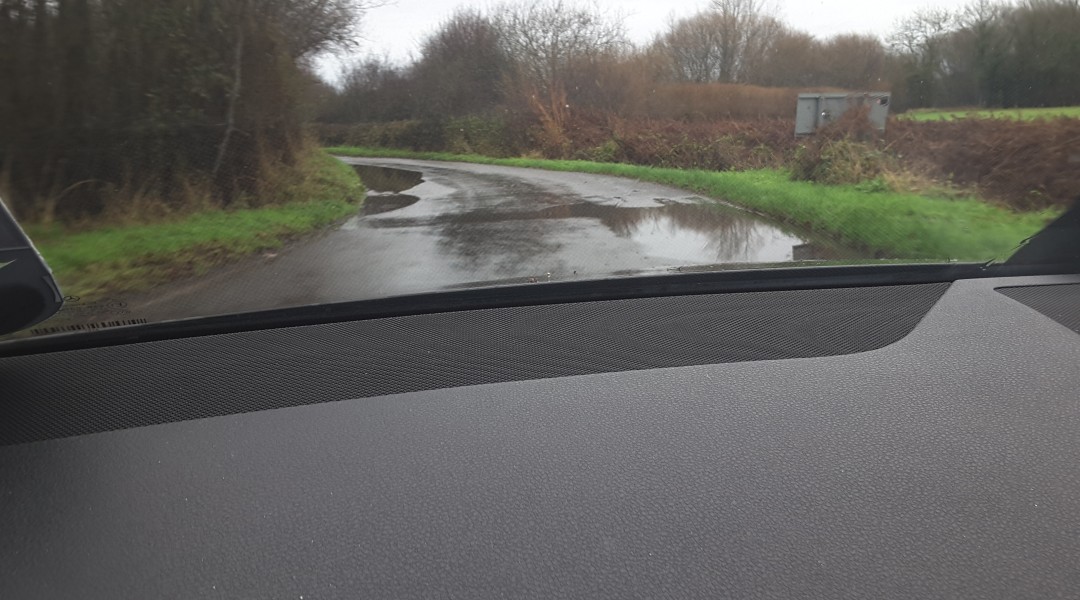
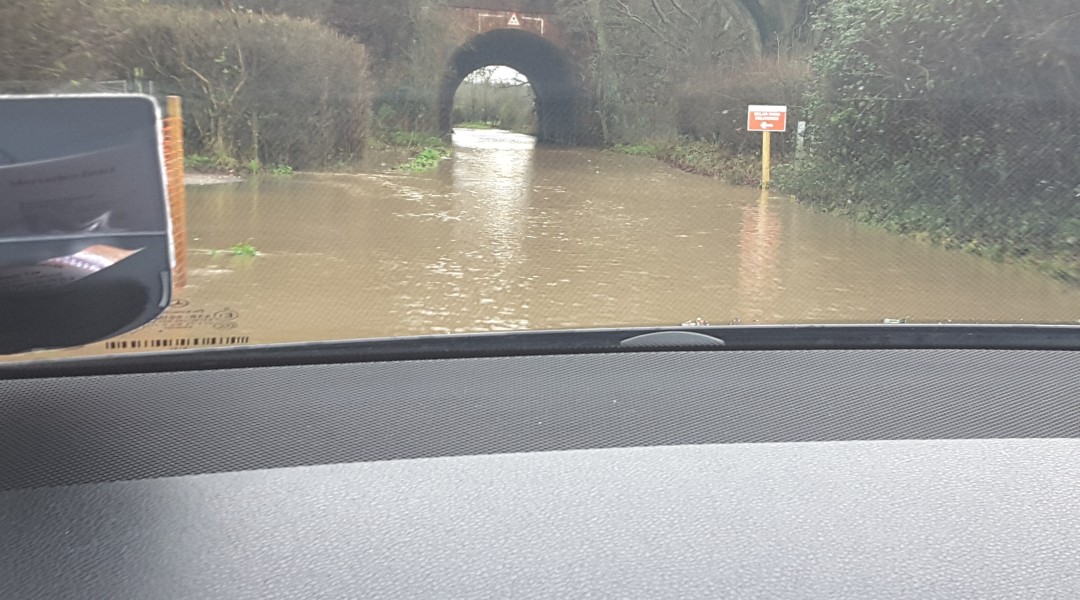
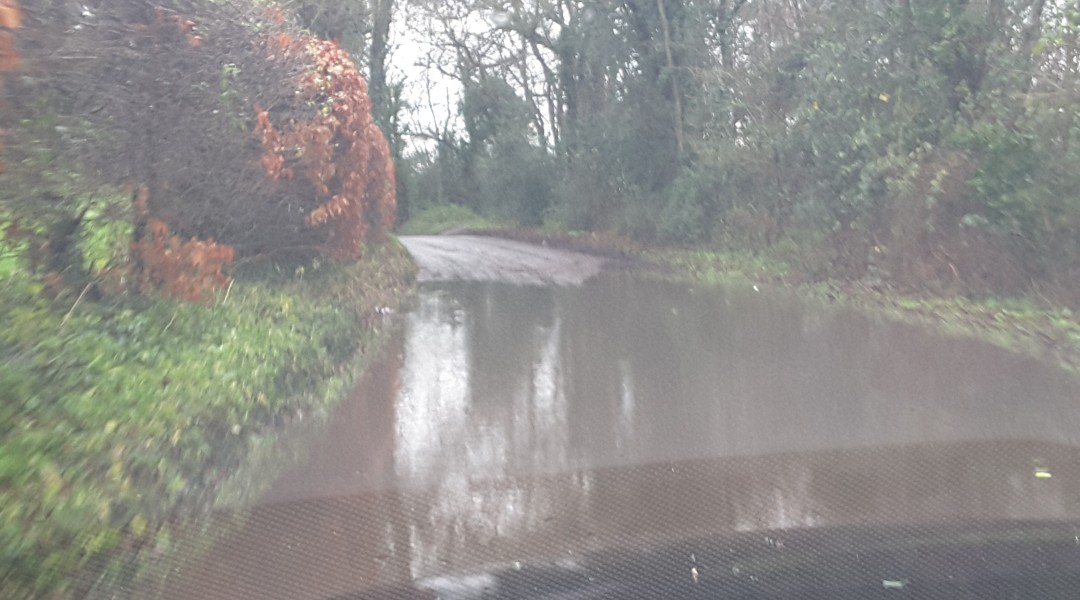
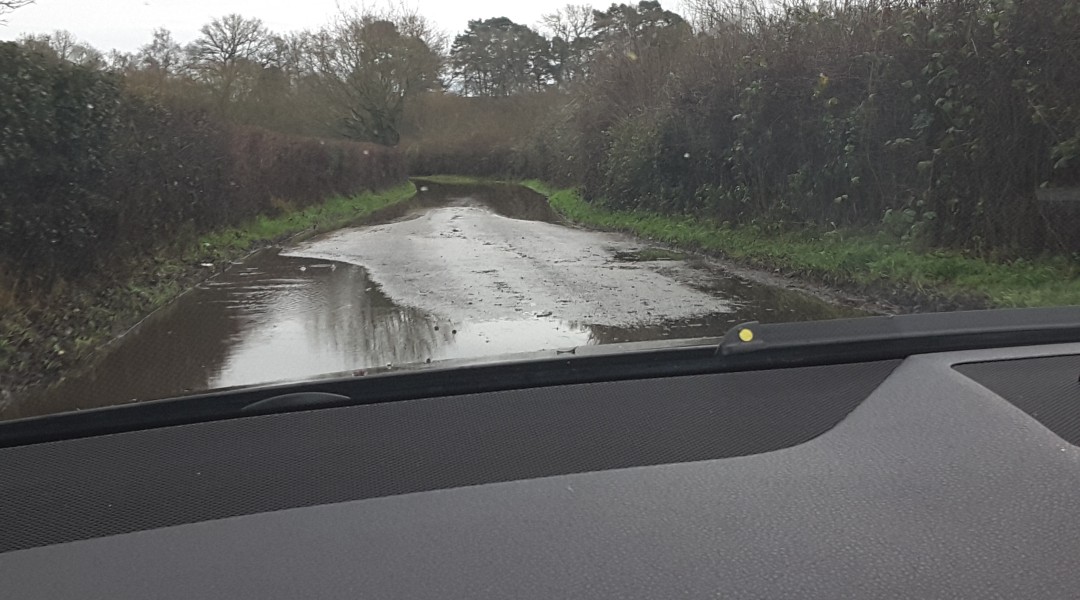
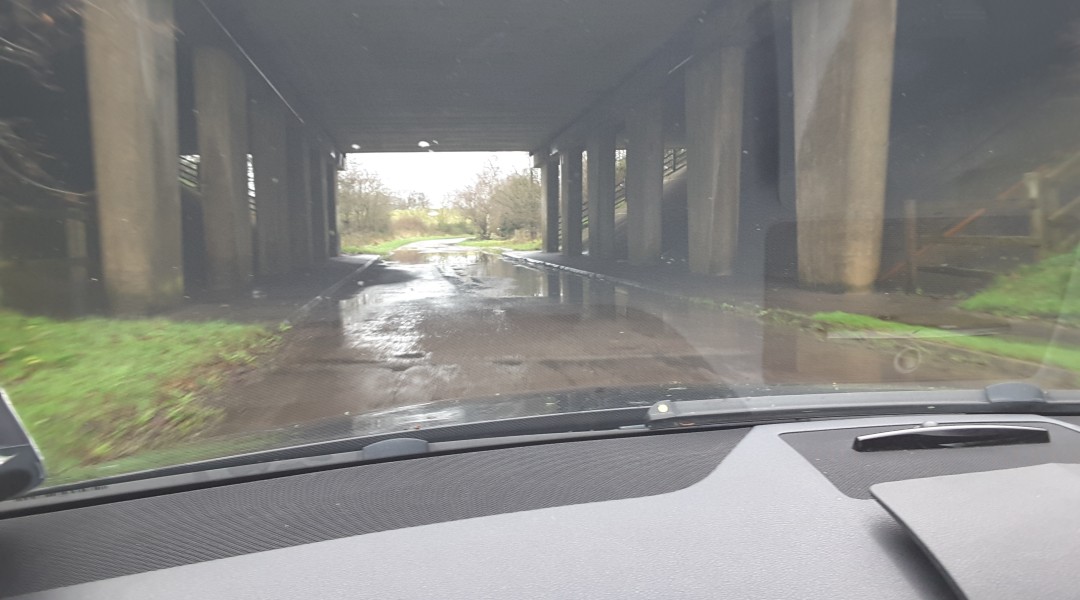
Flood Taplins Farm Road Winchfield 3 January 2016.

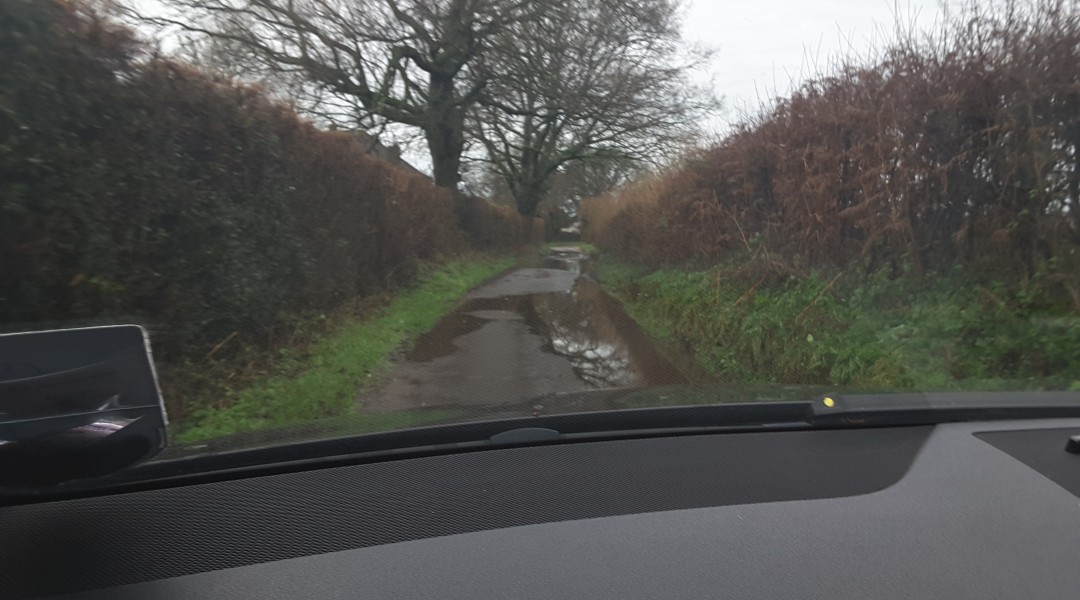
Flood Taplins Farm Road Winchfield 3 January 2016.

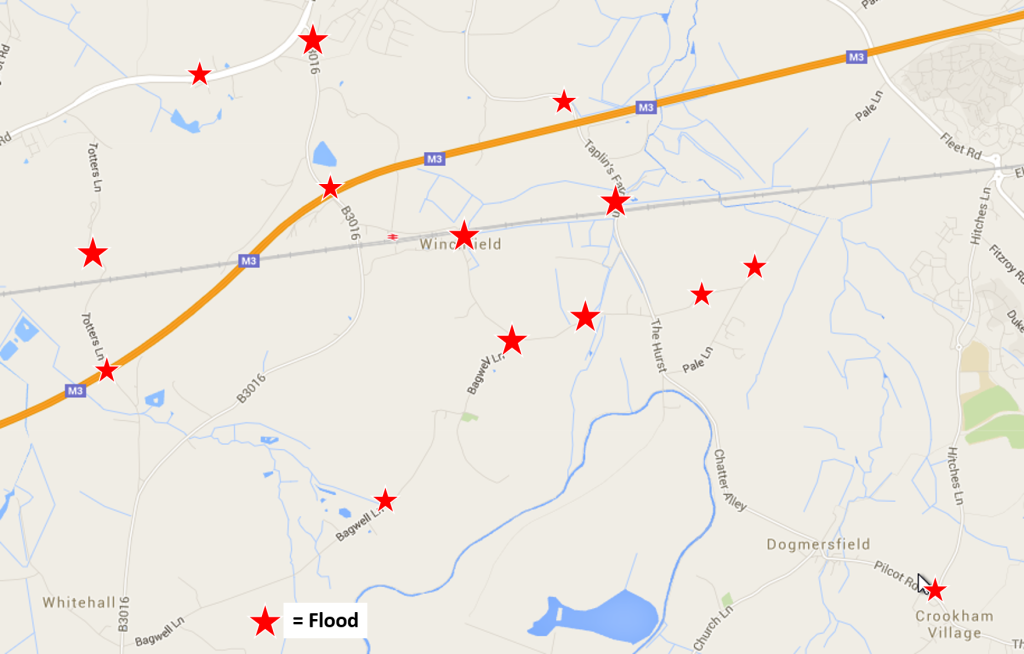
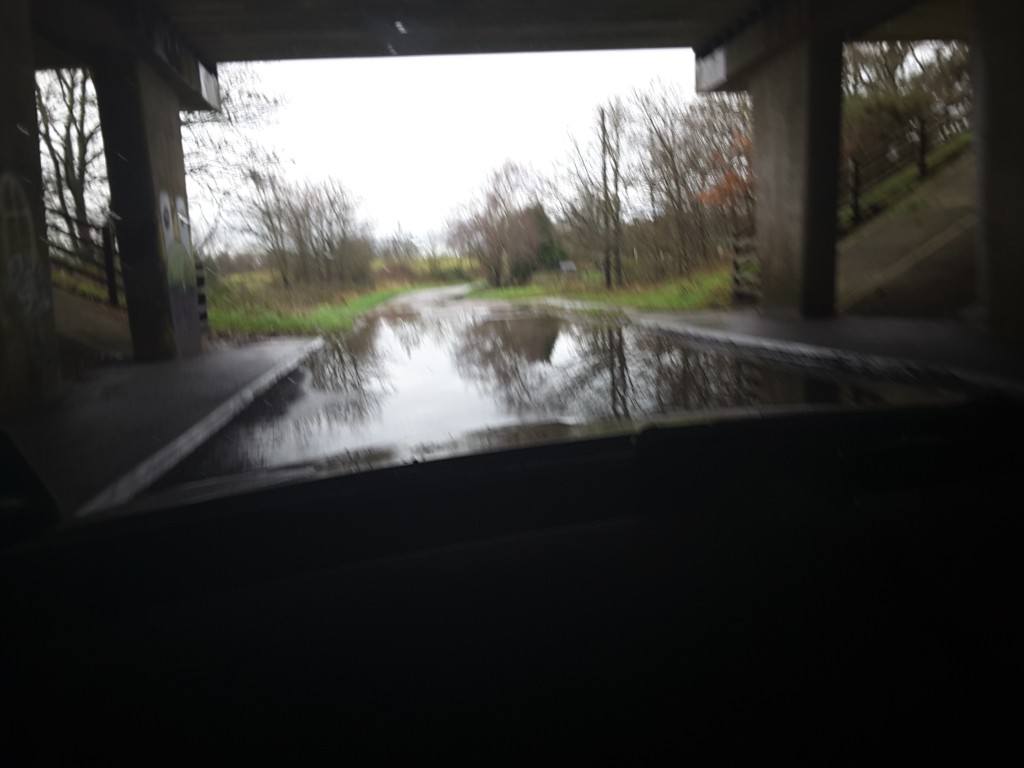
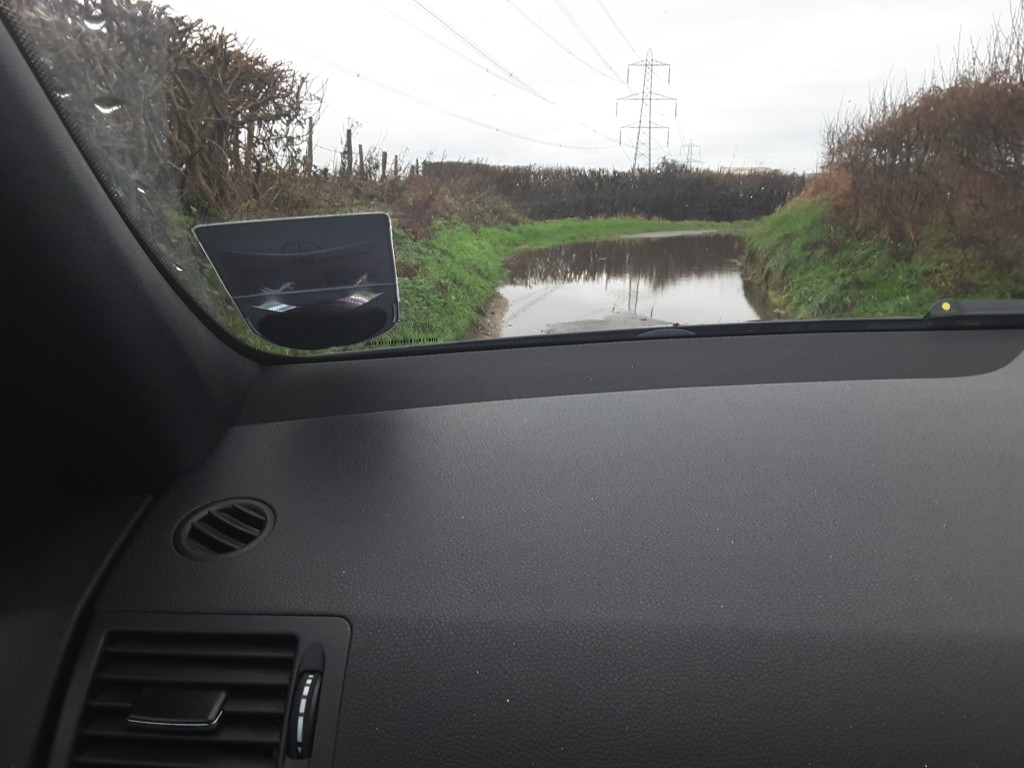
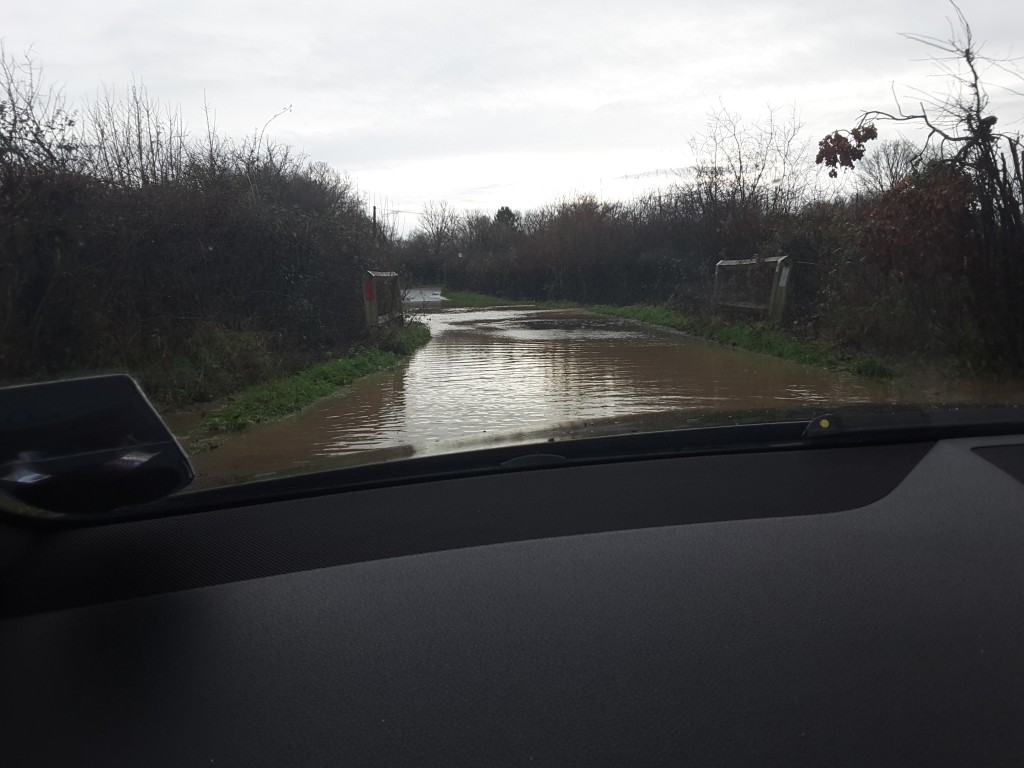
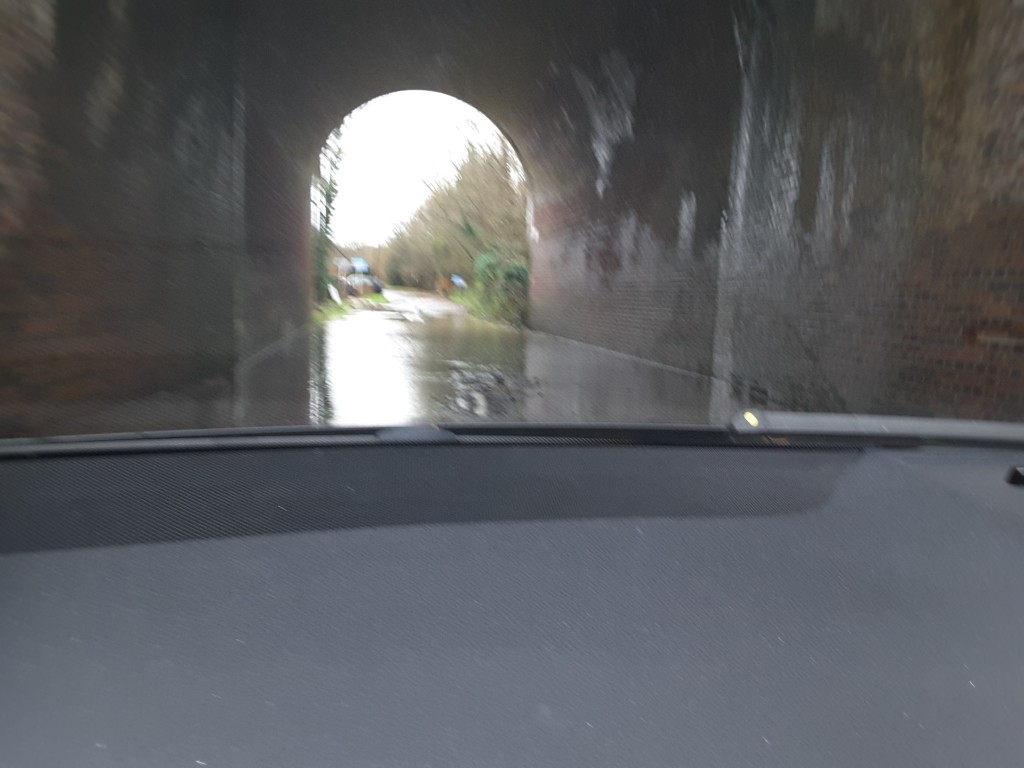
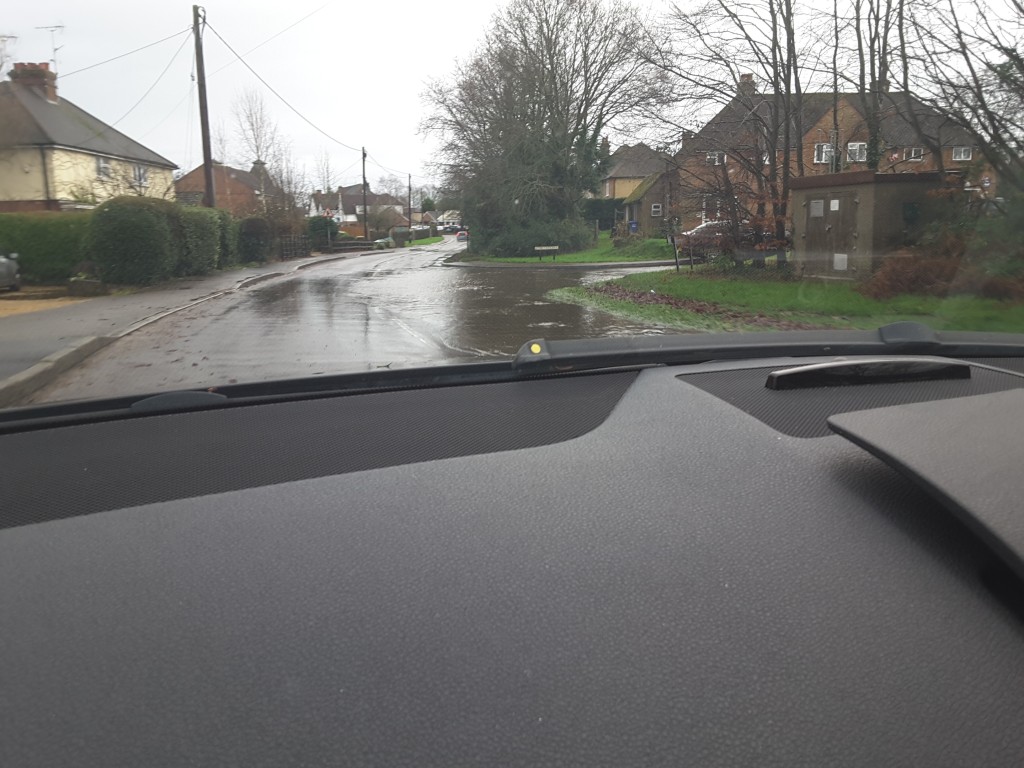
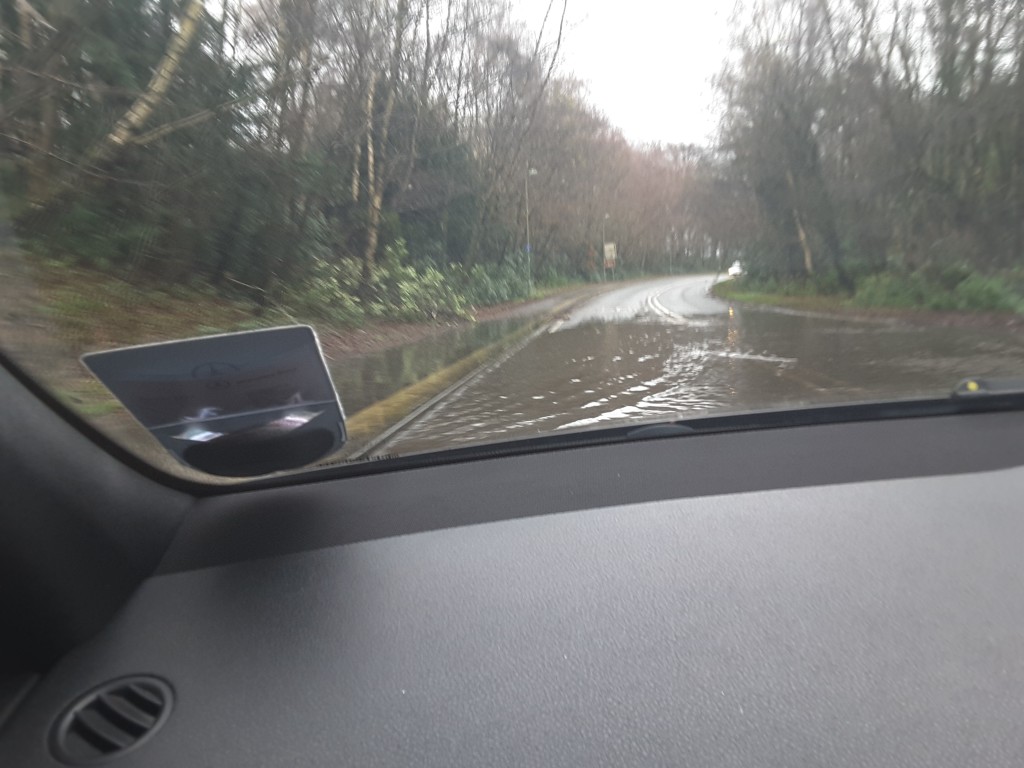
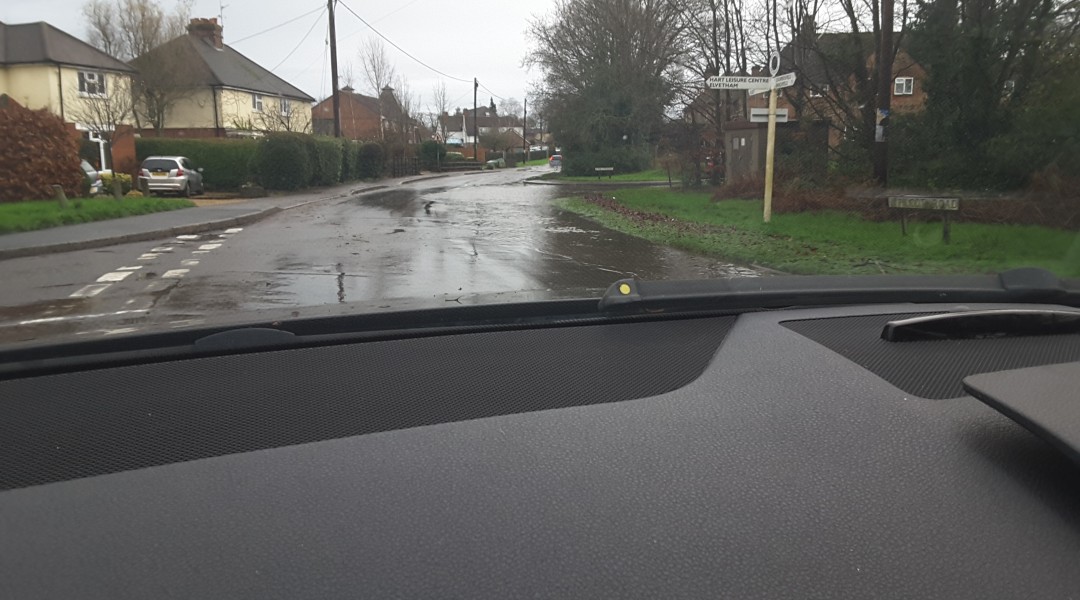
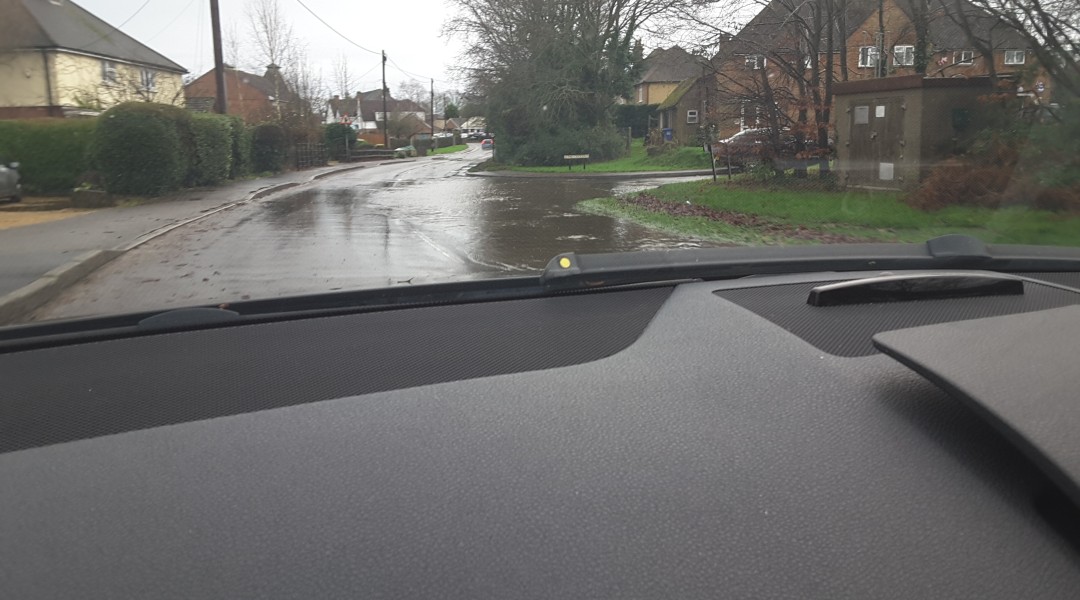
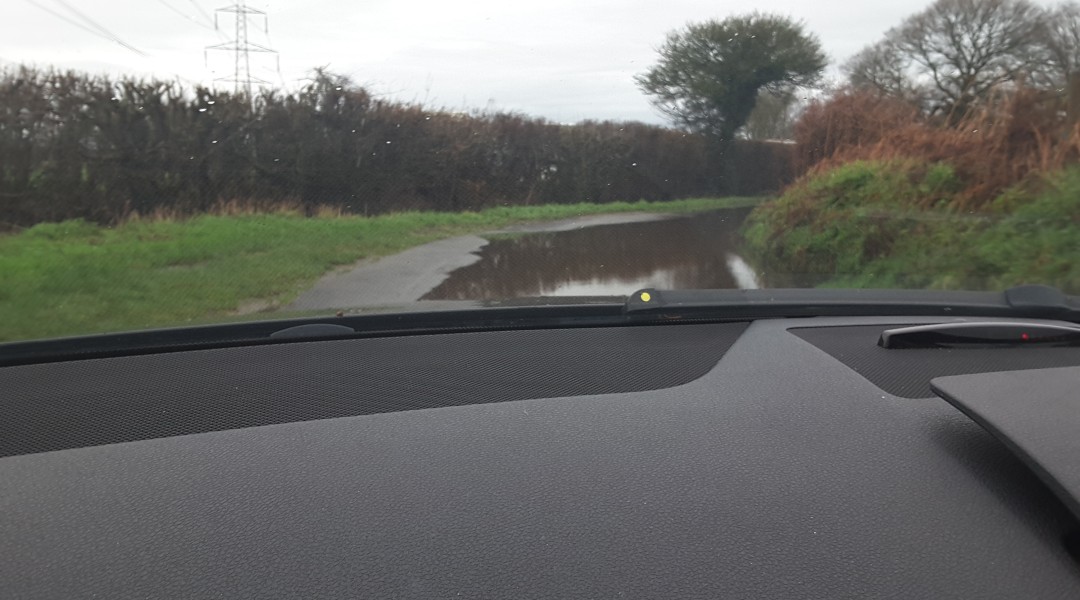
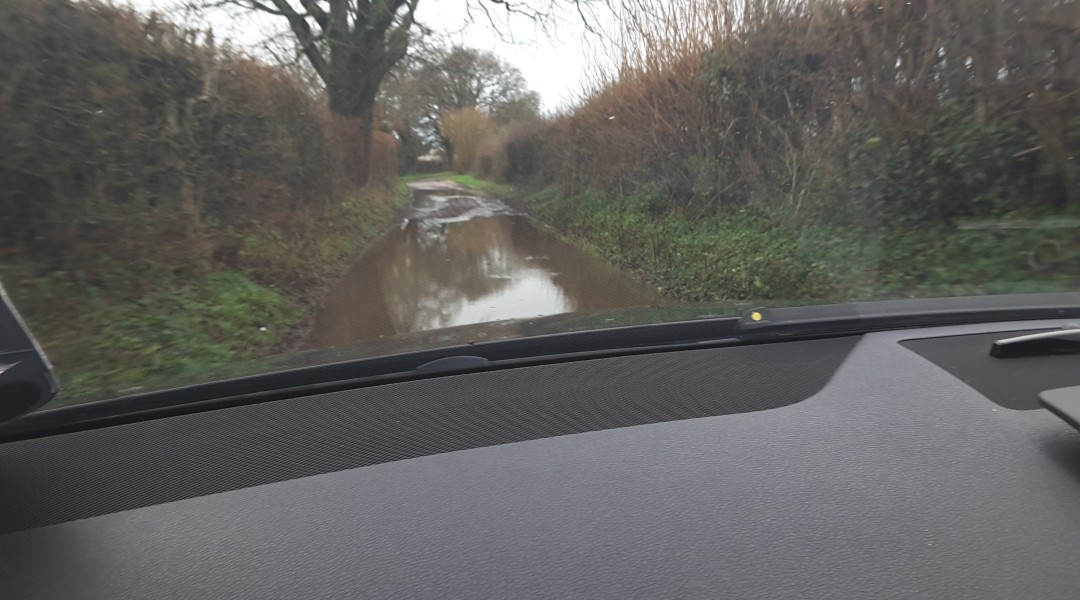
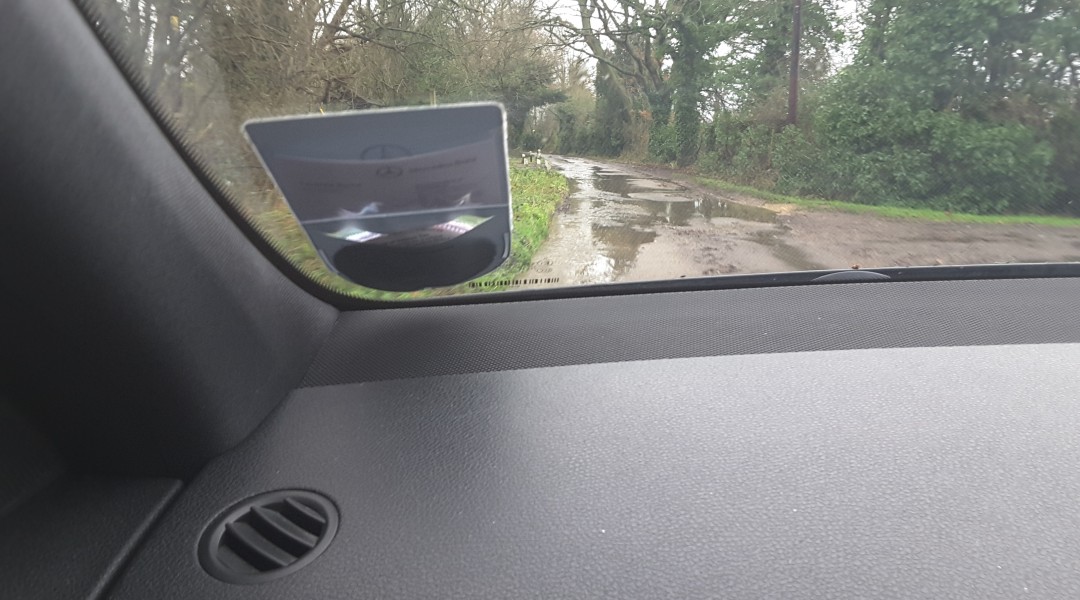
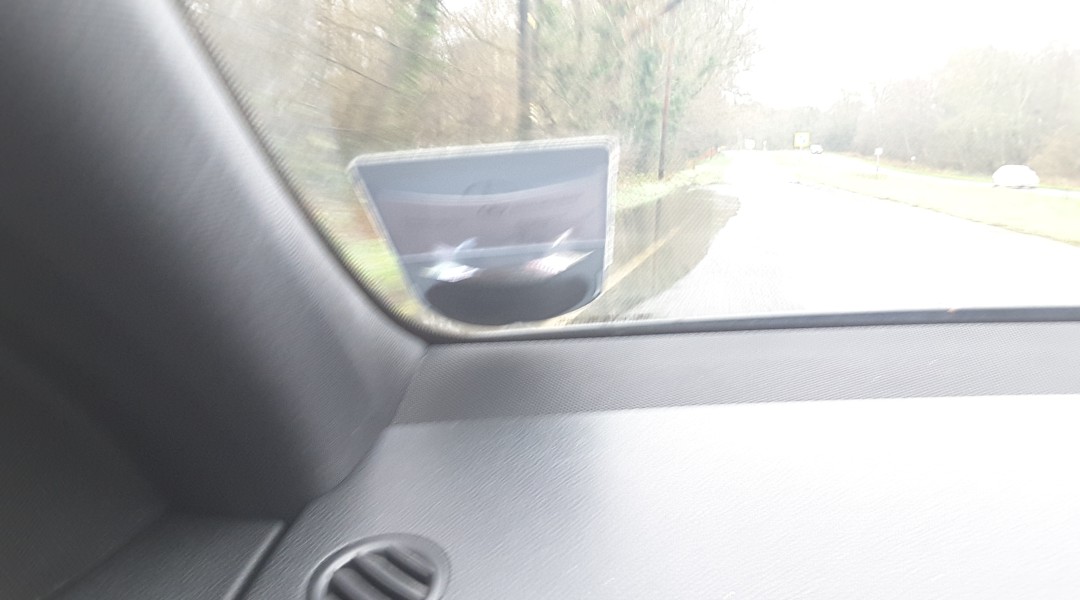
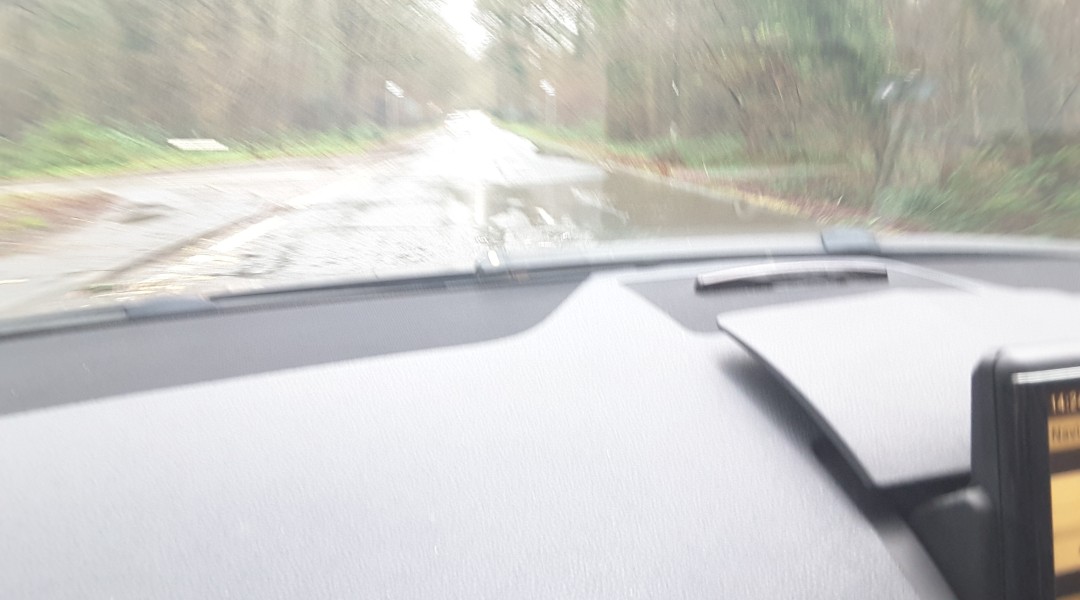
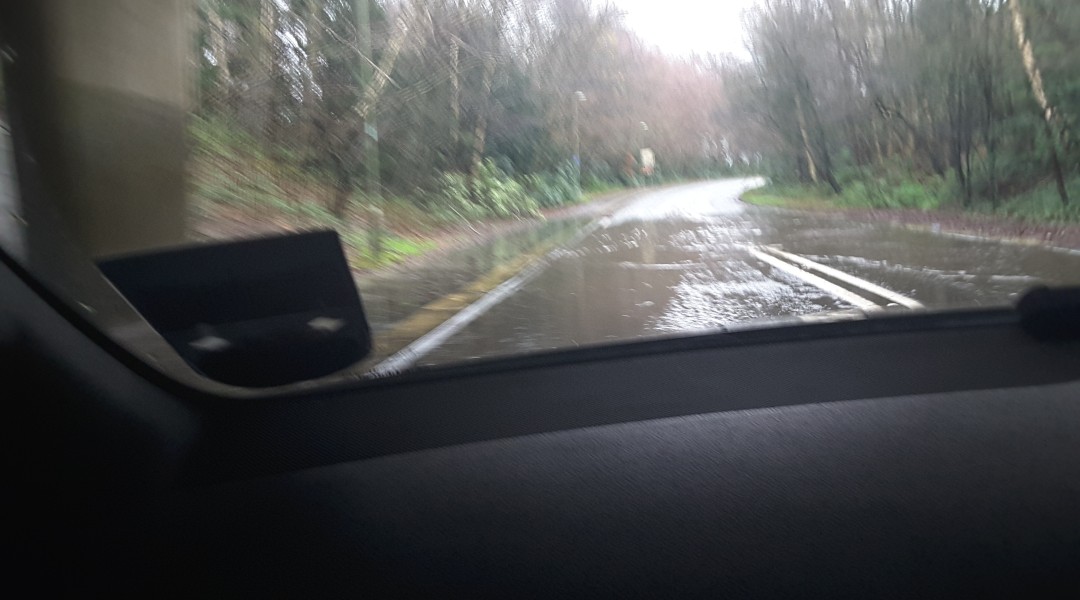
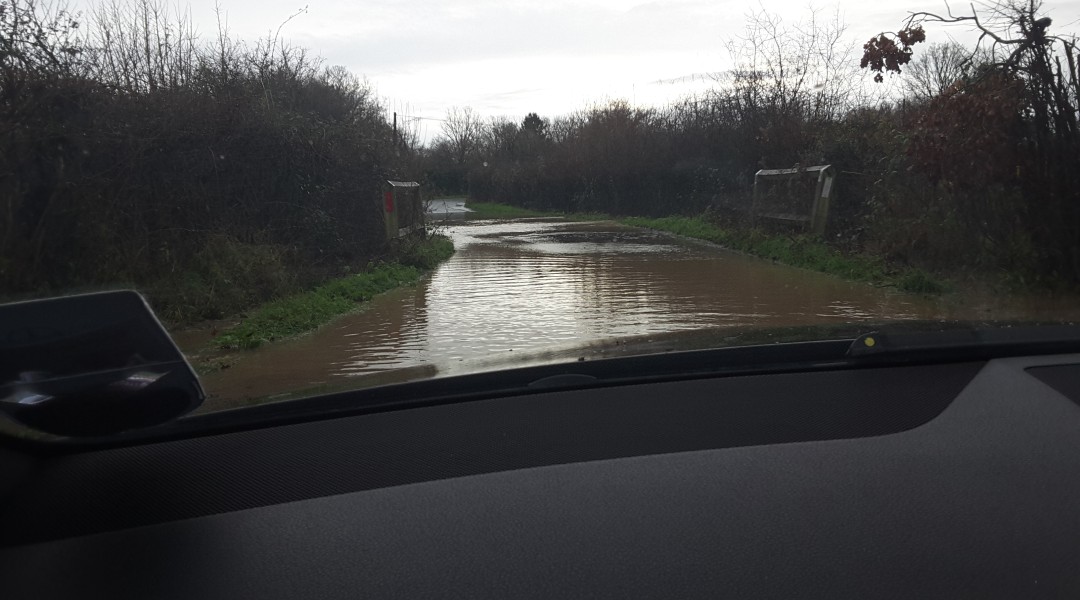
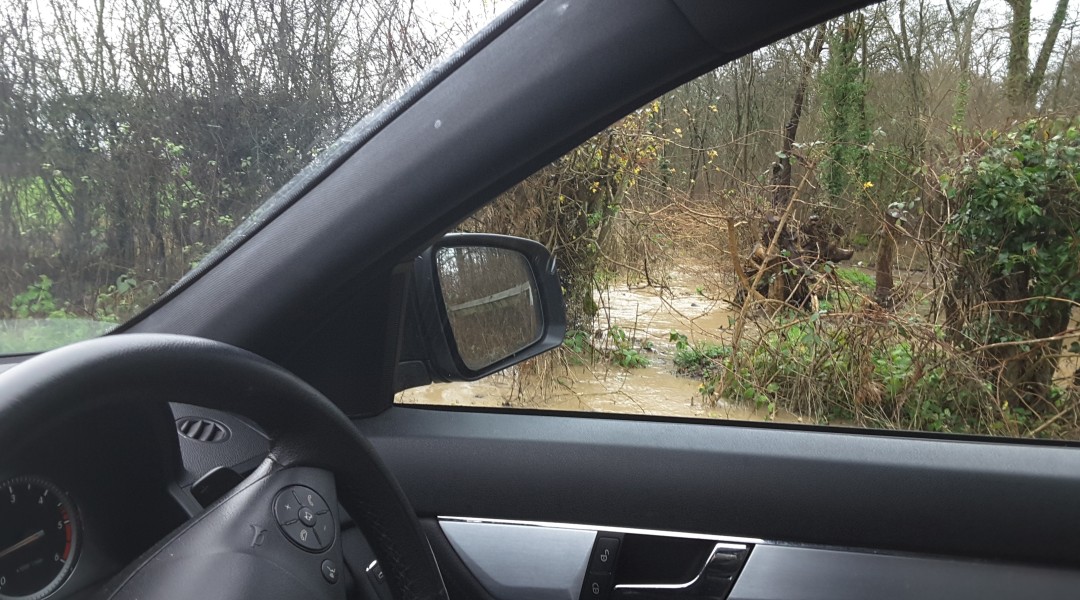
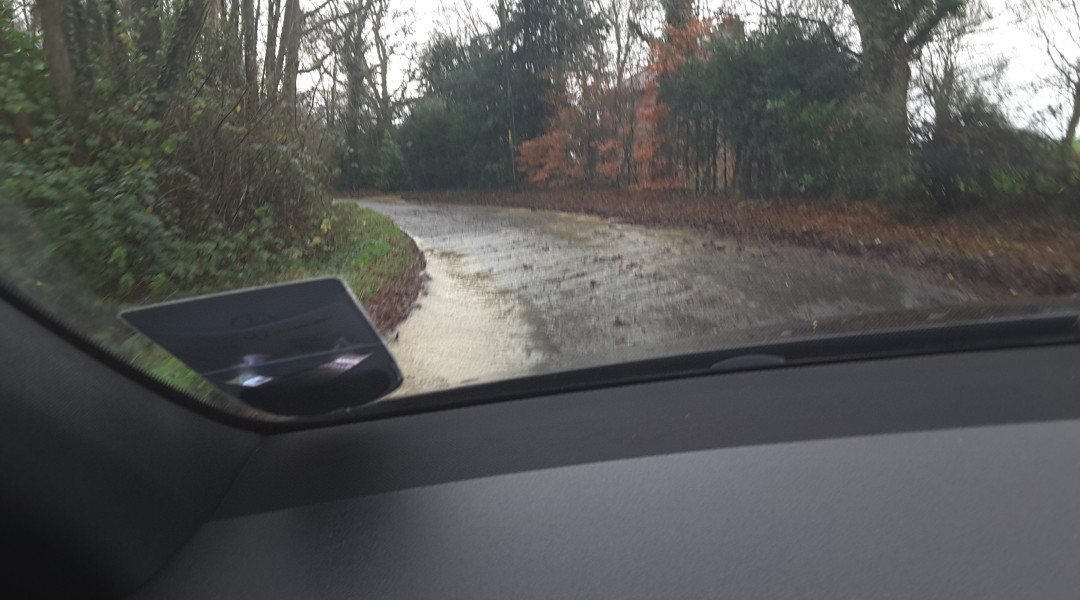
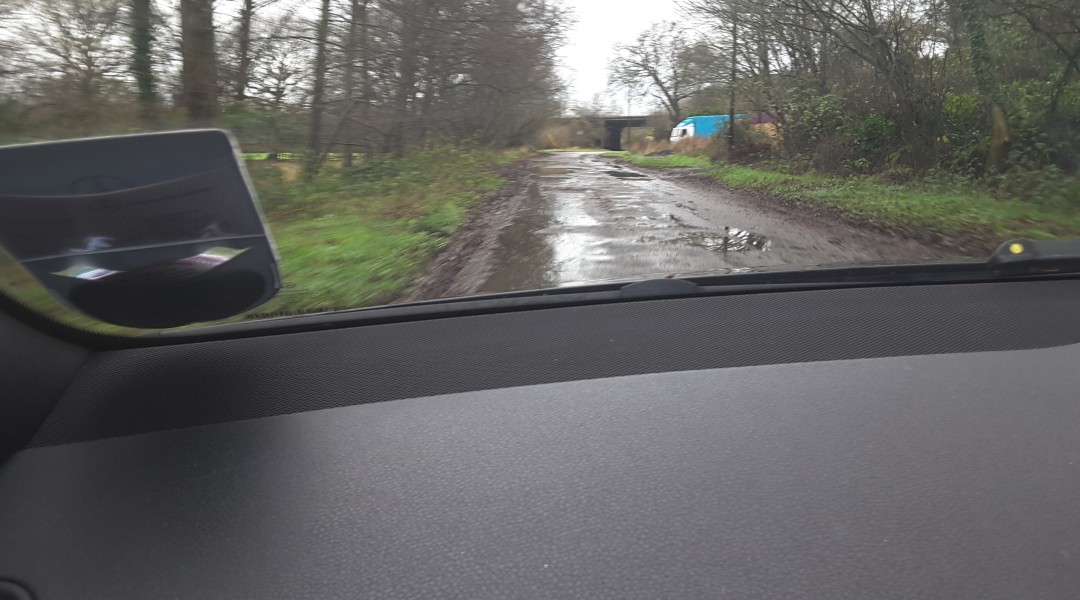
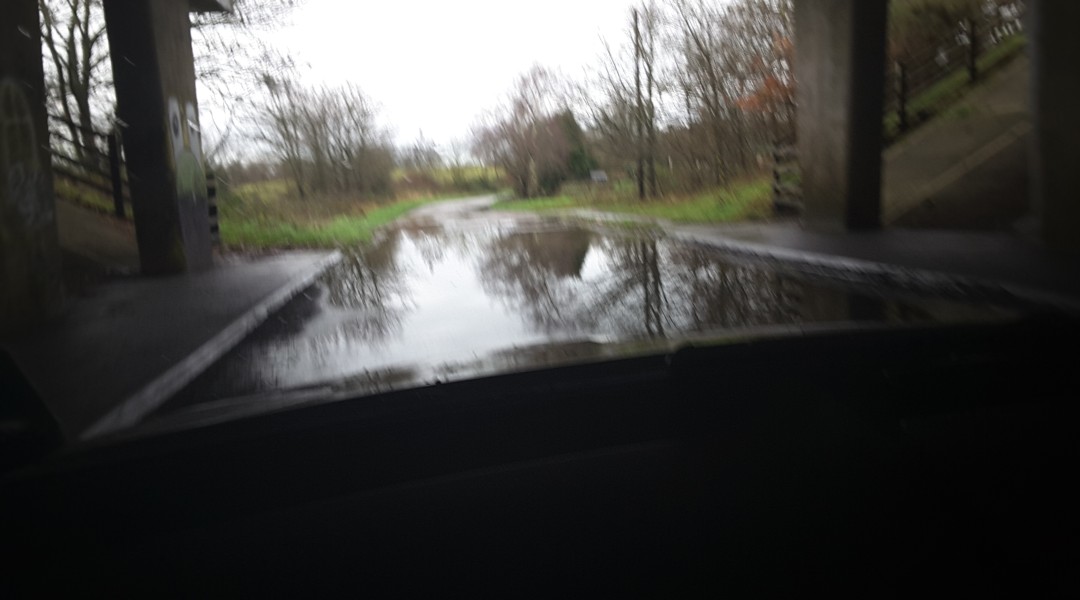
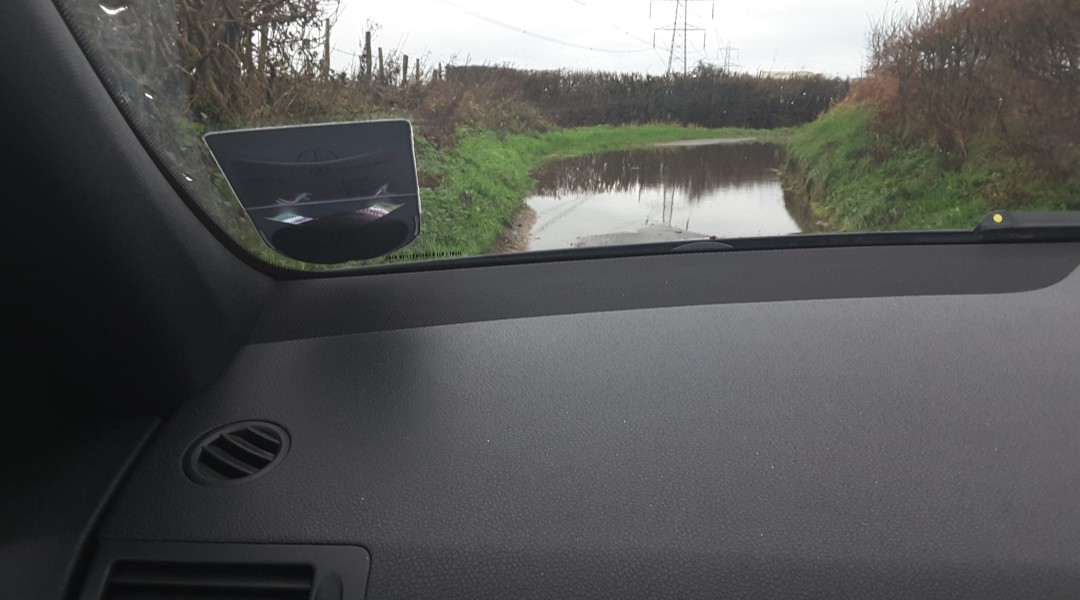
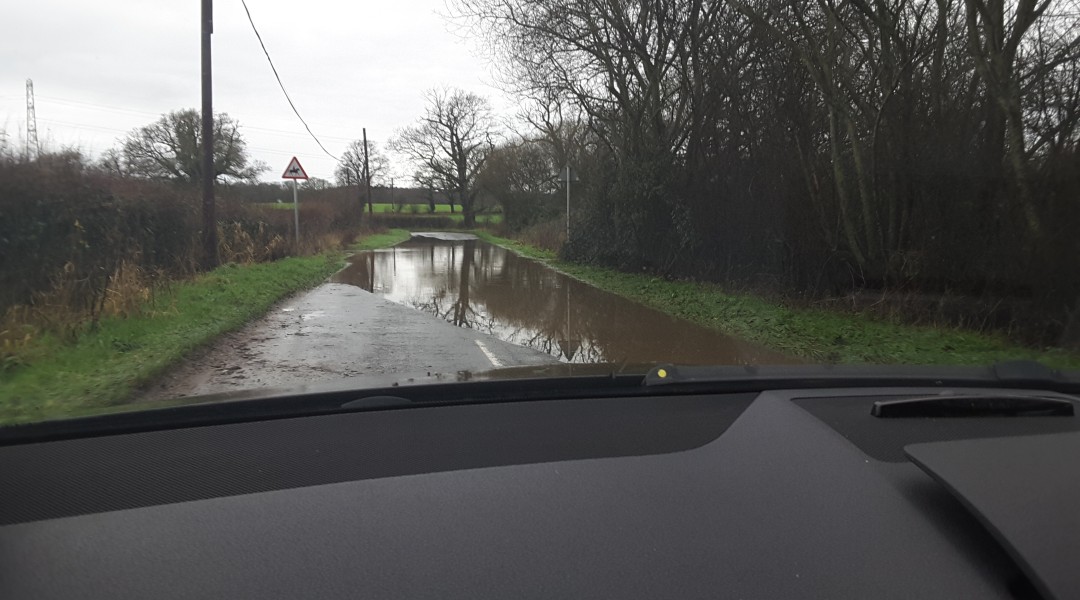
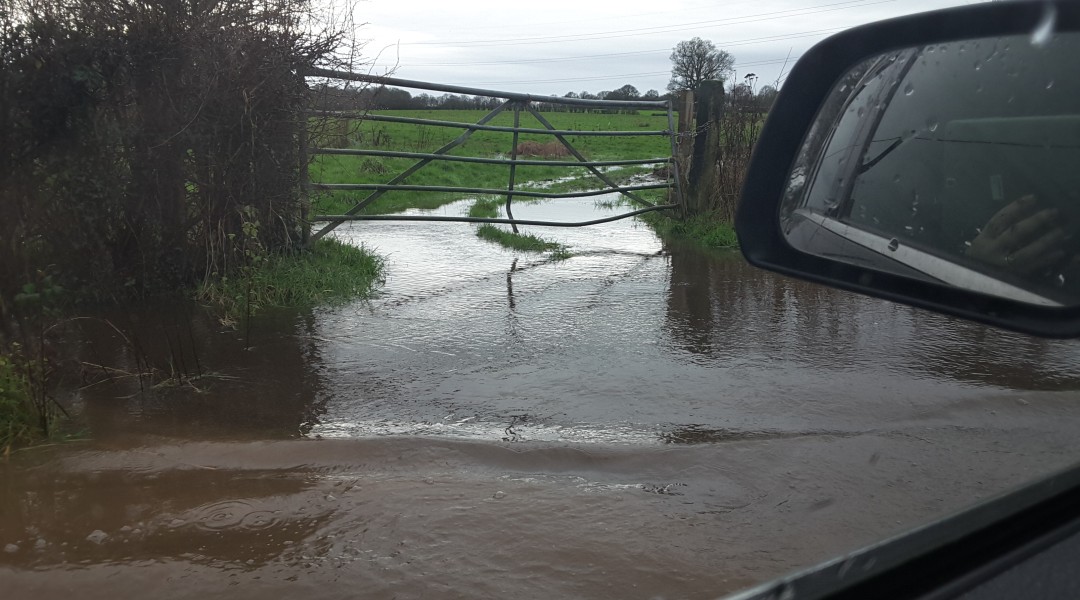
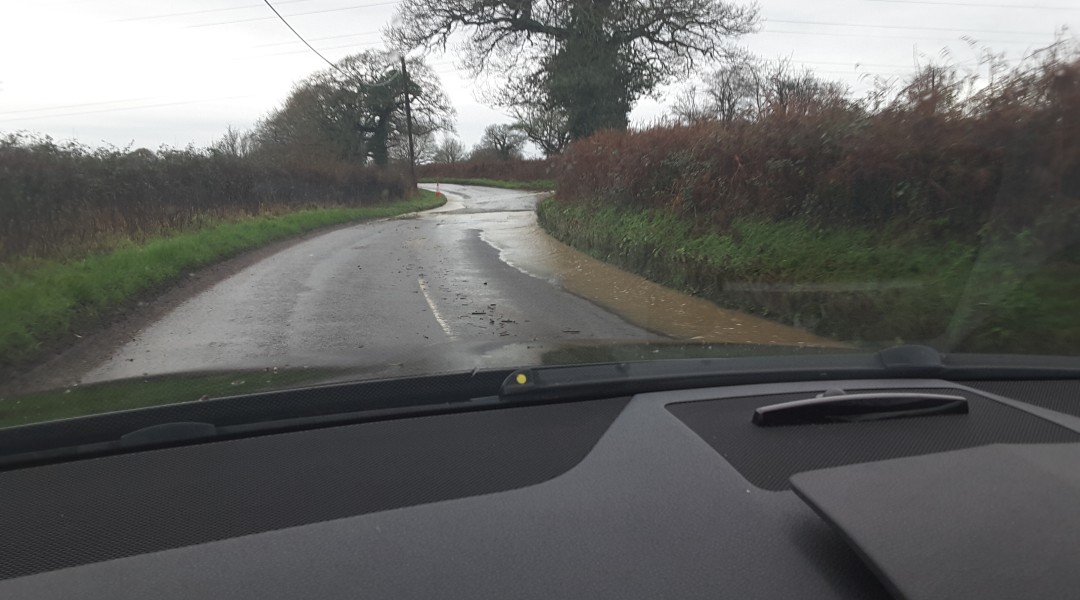
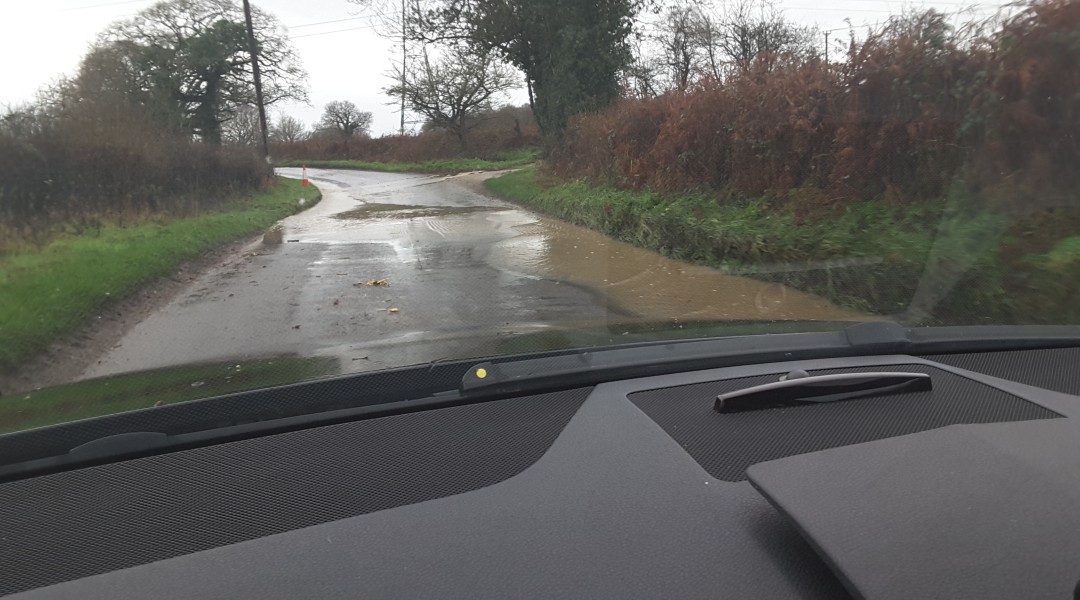
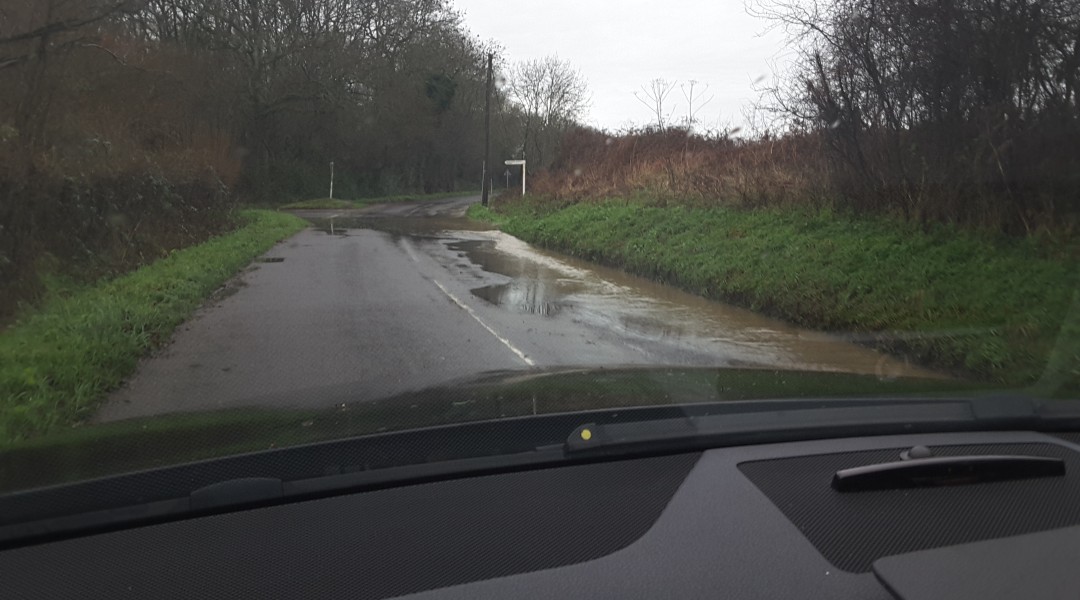
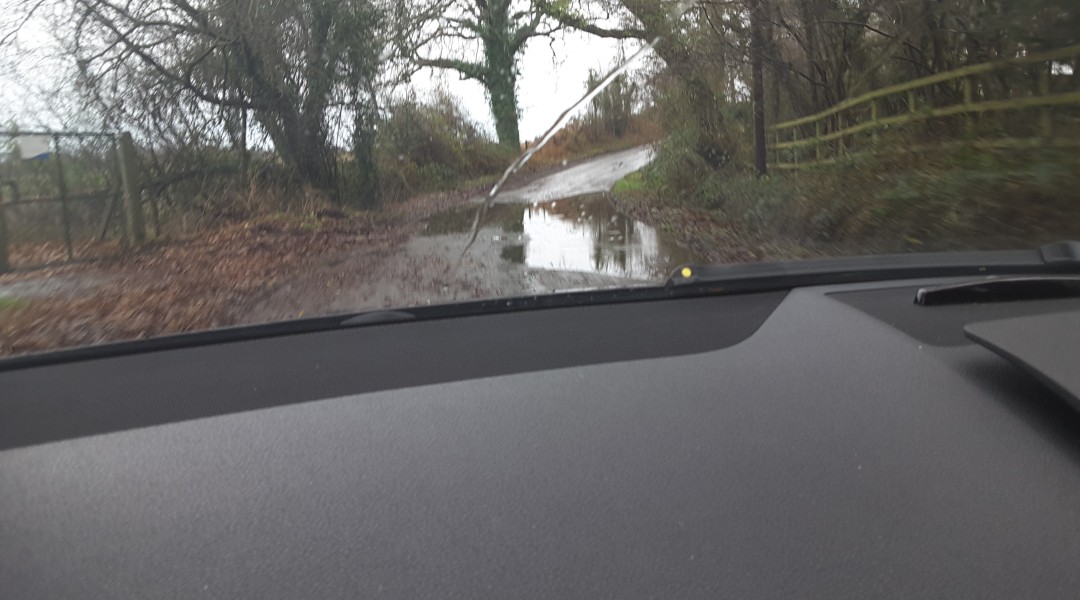
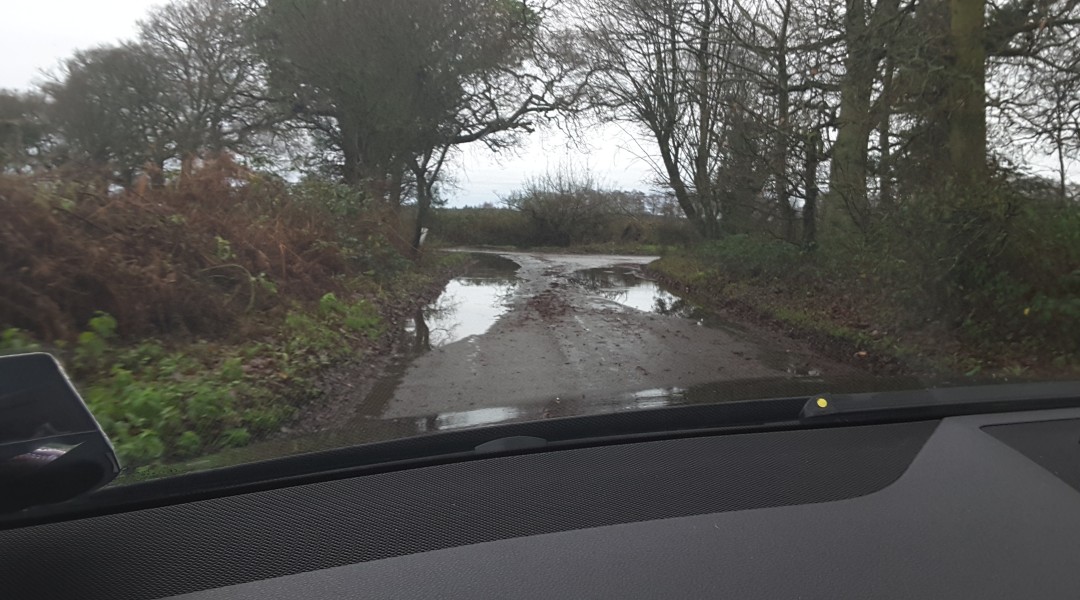
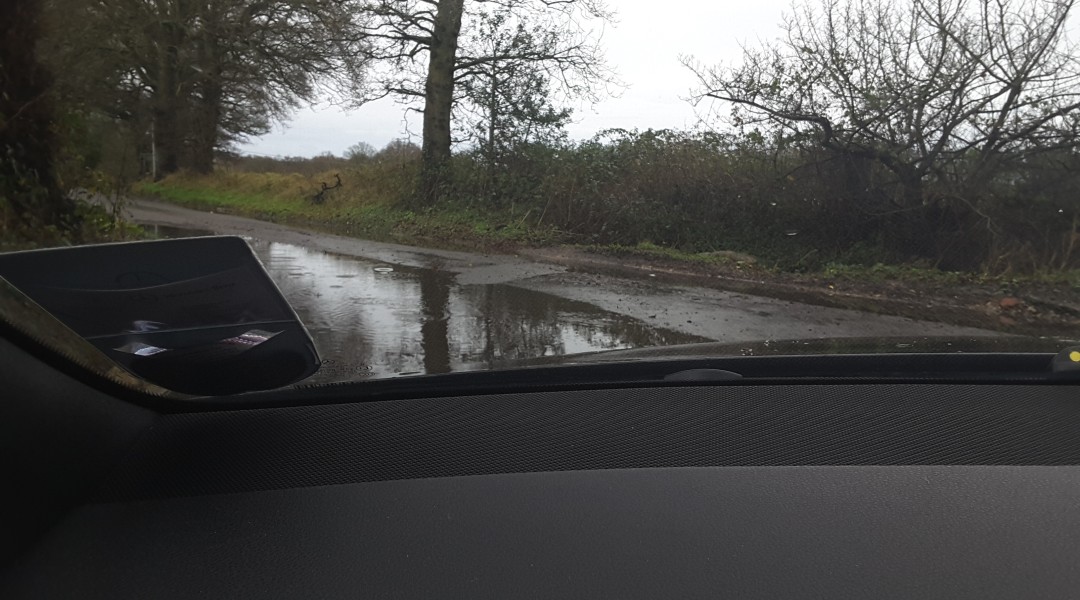
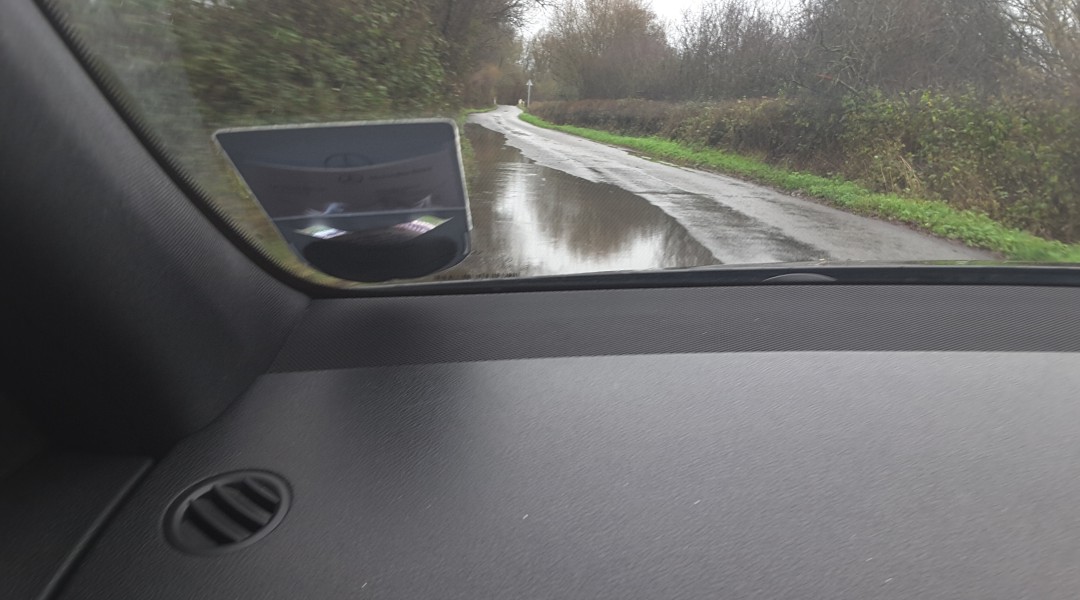
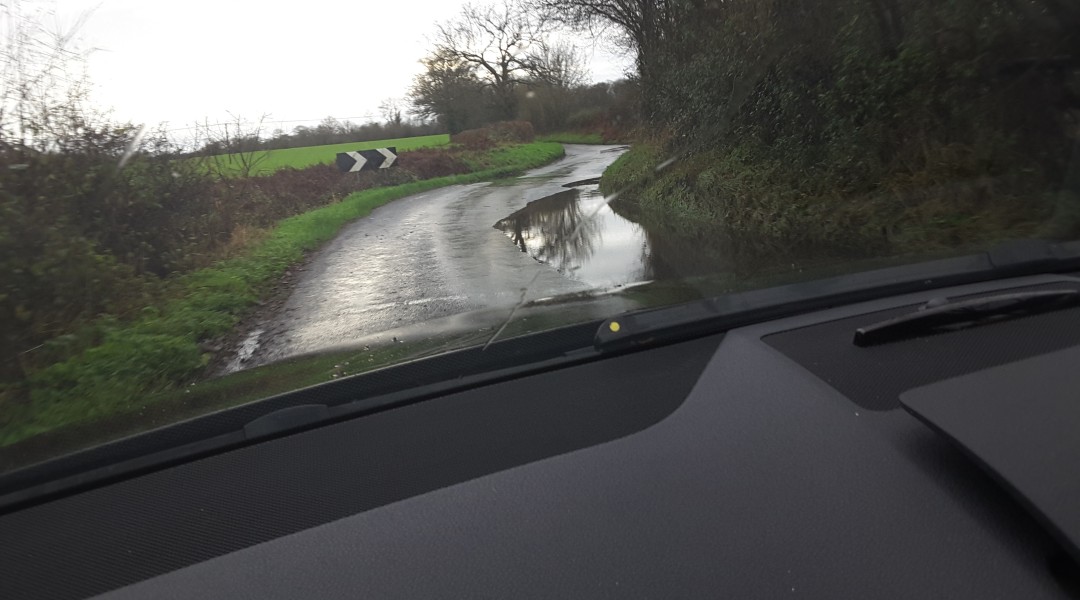
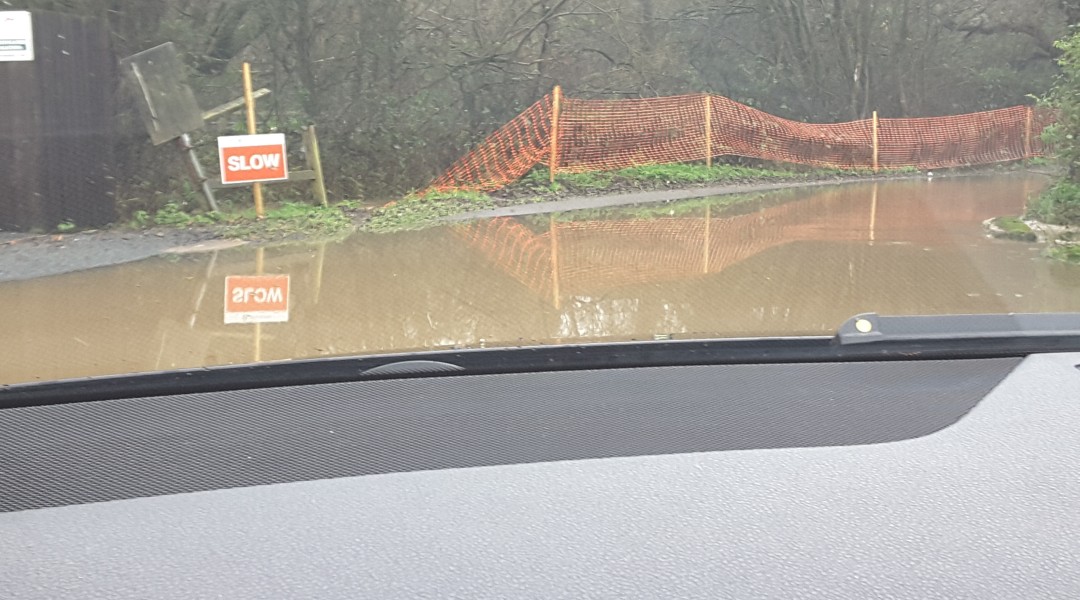
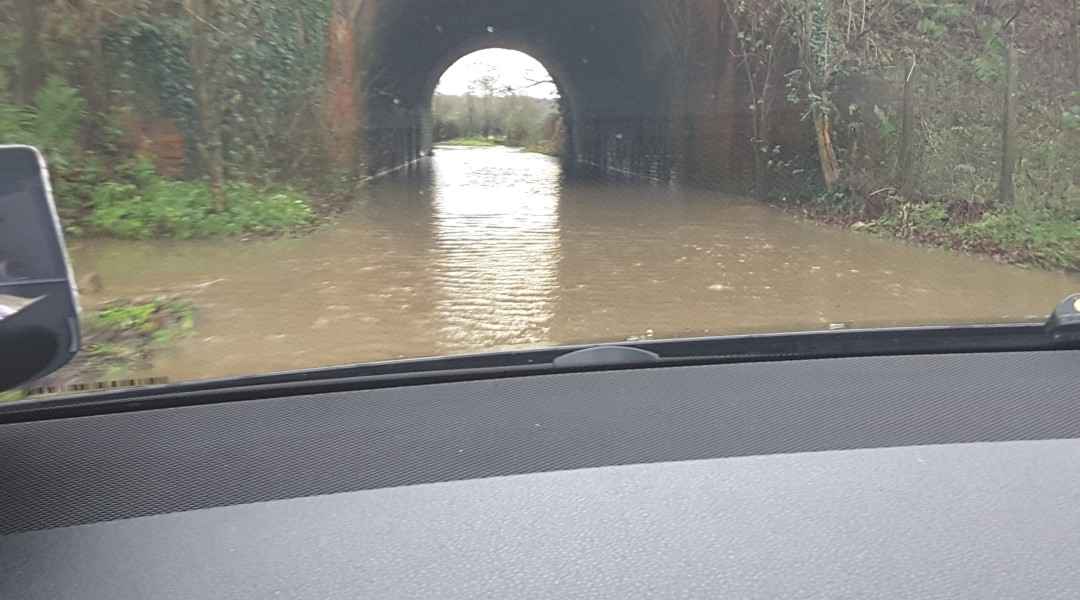
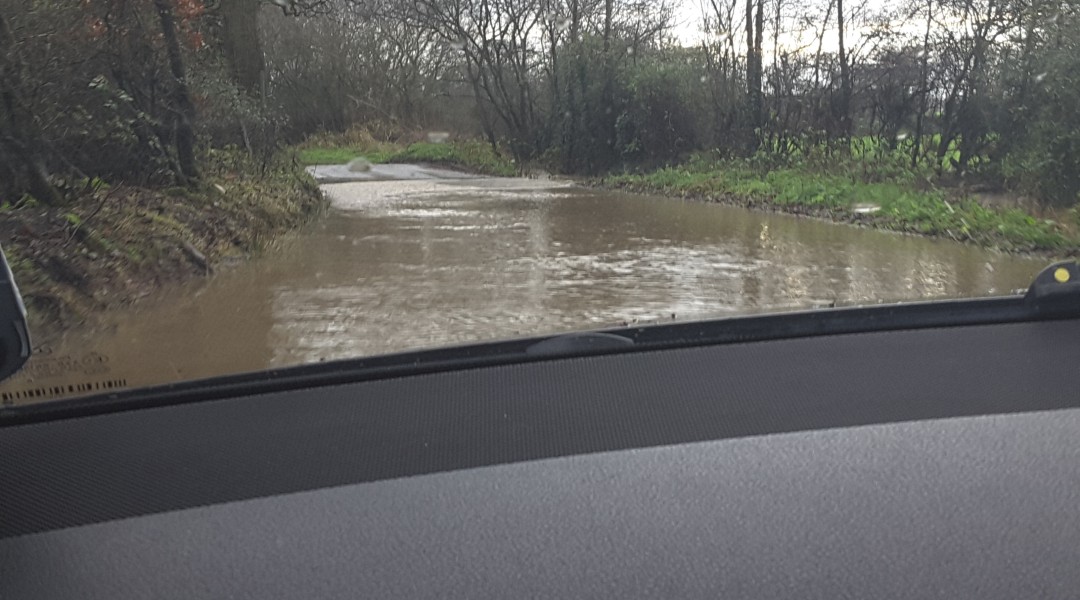
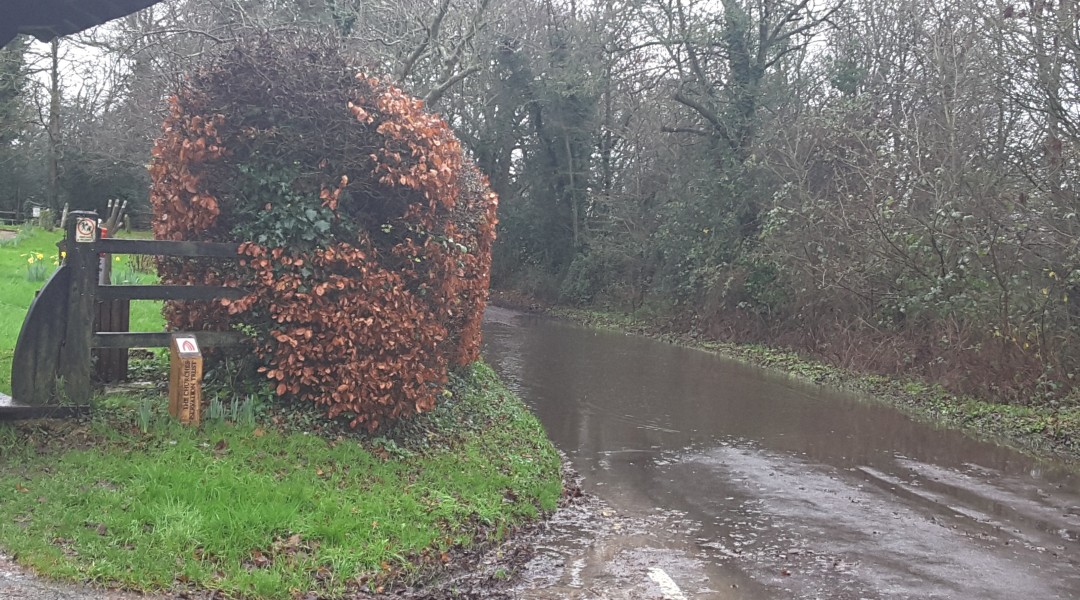
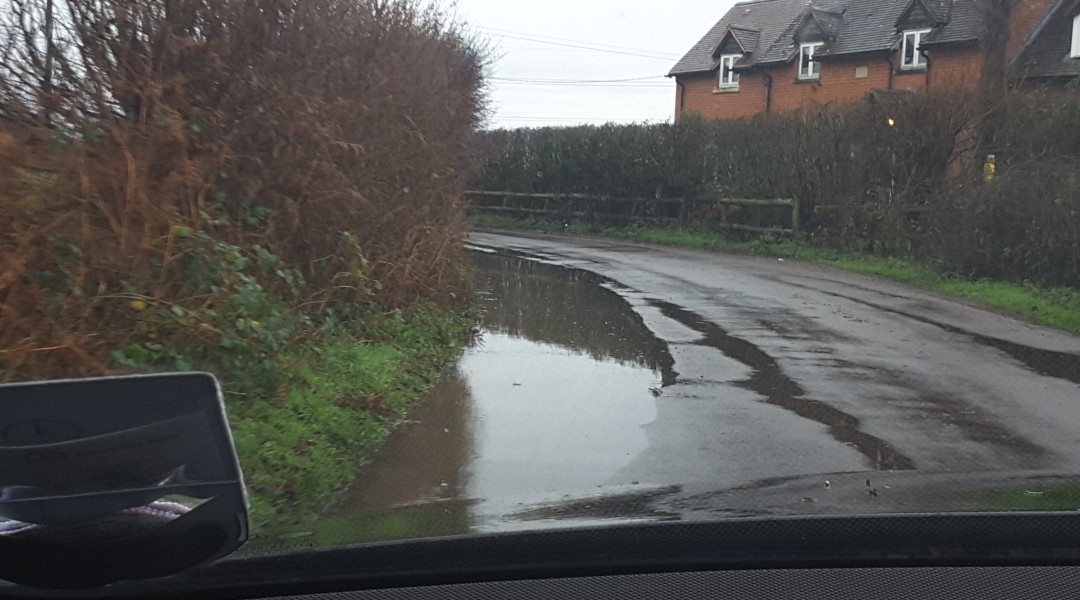
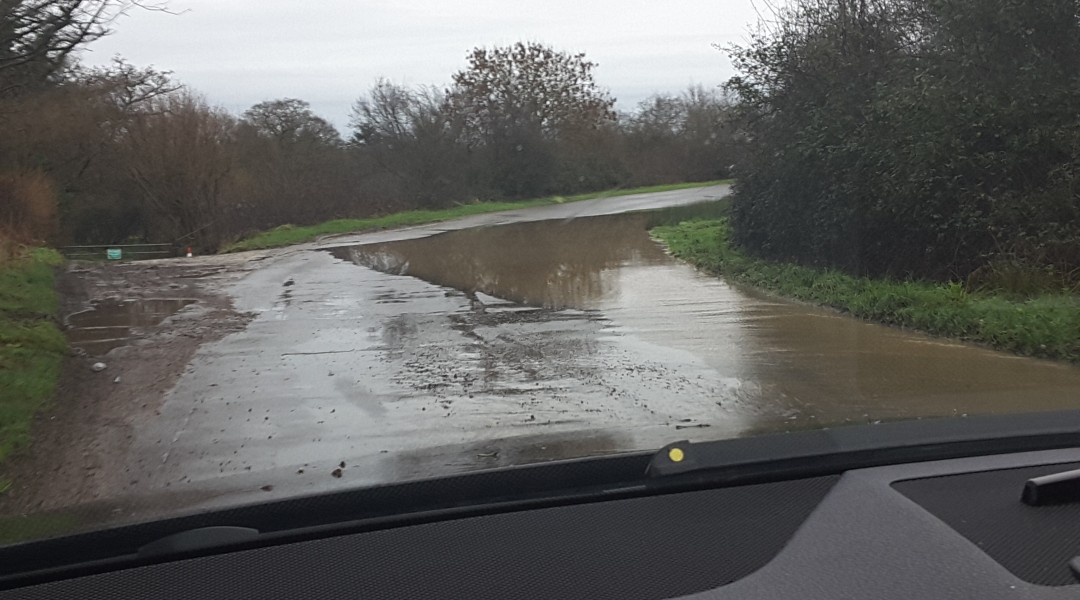
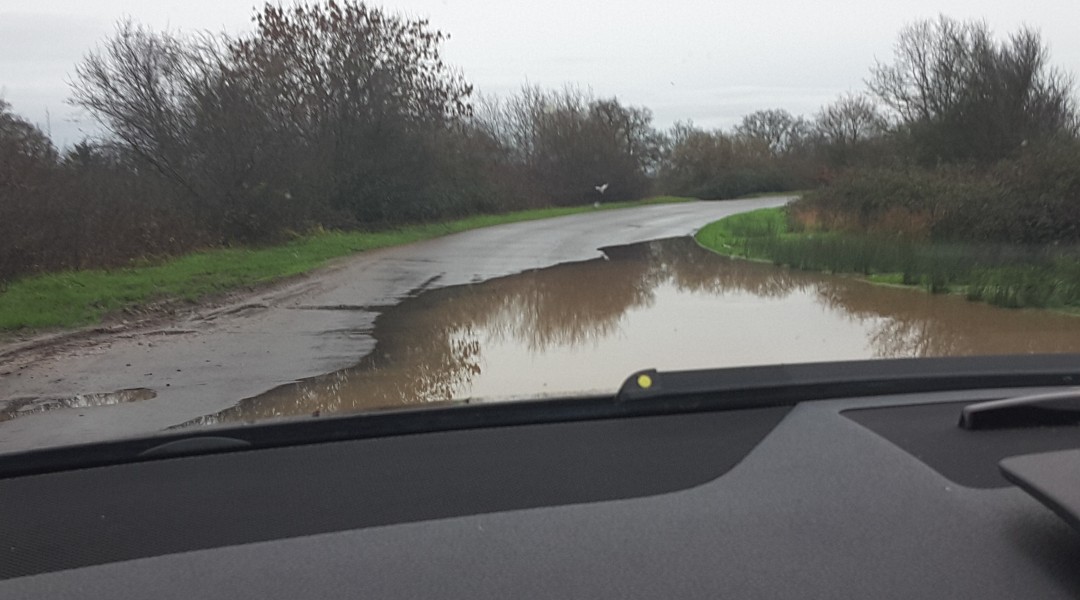
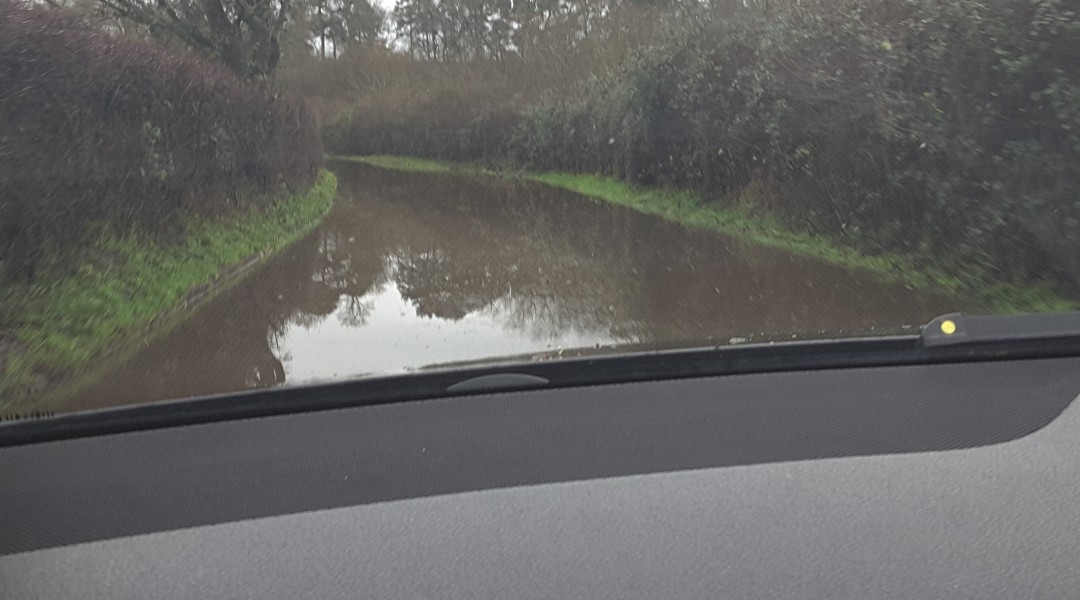
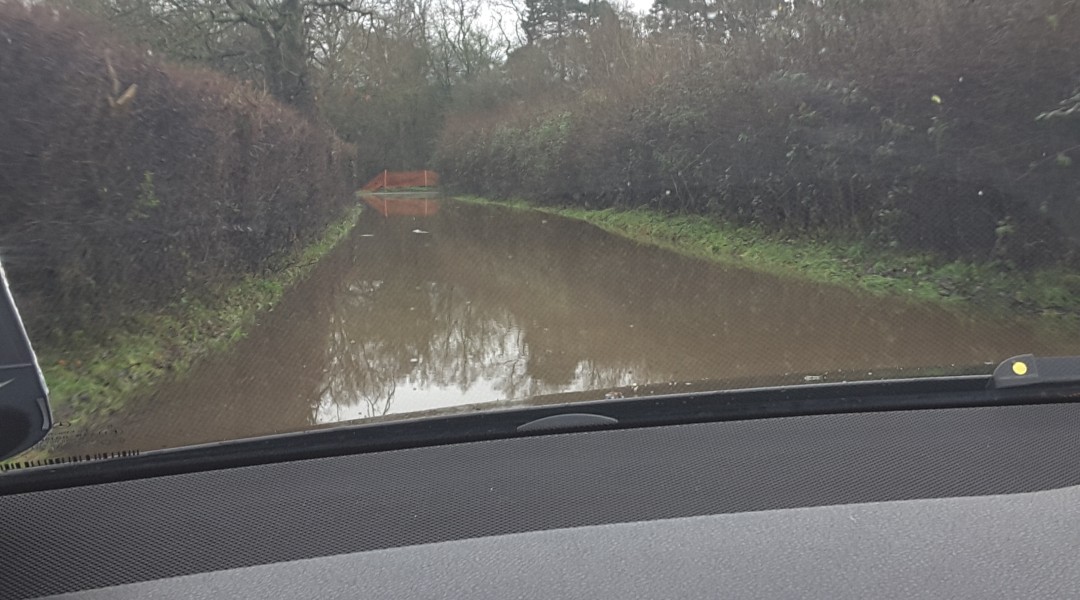
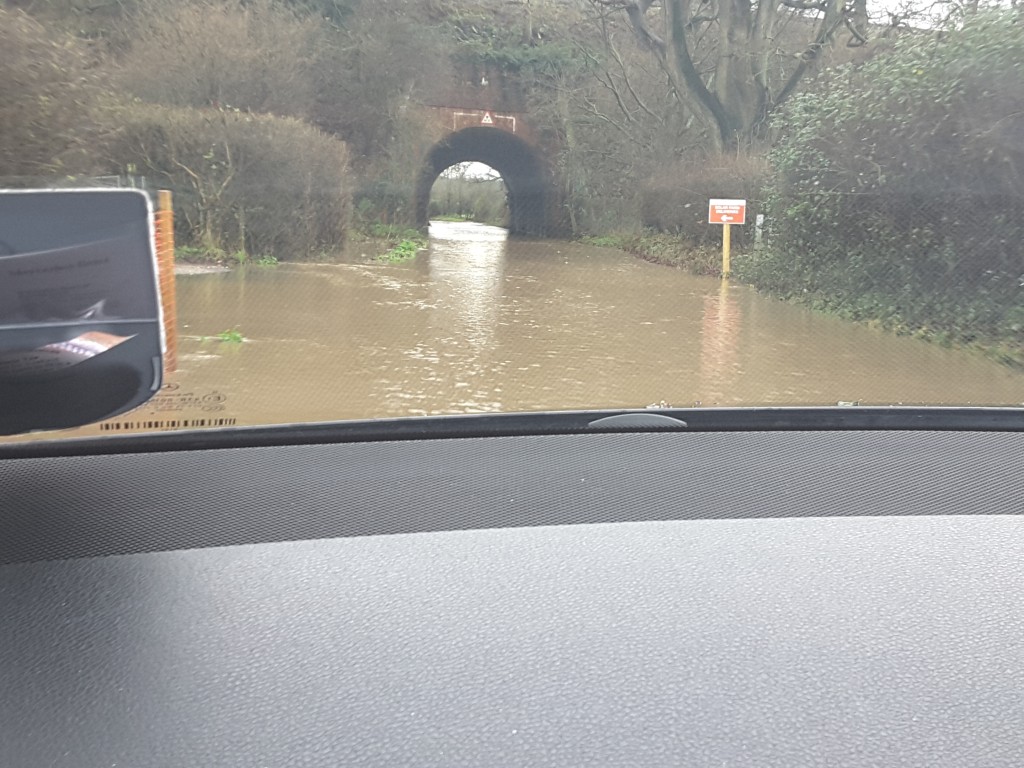
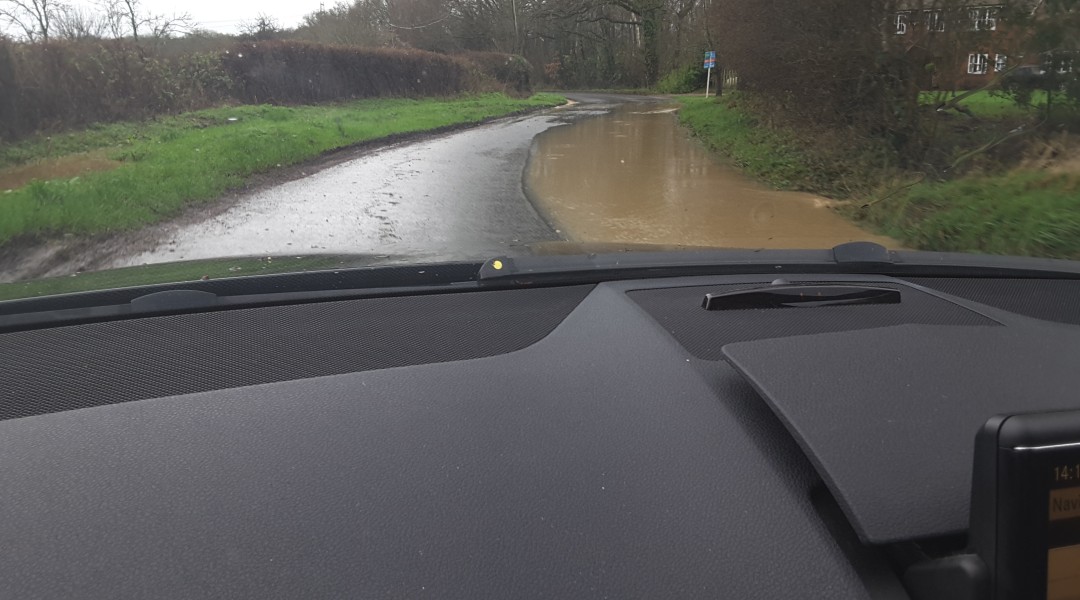
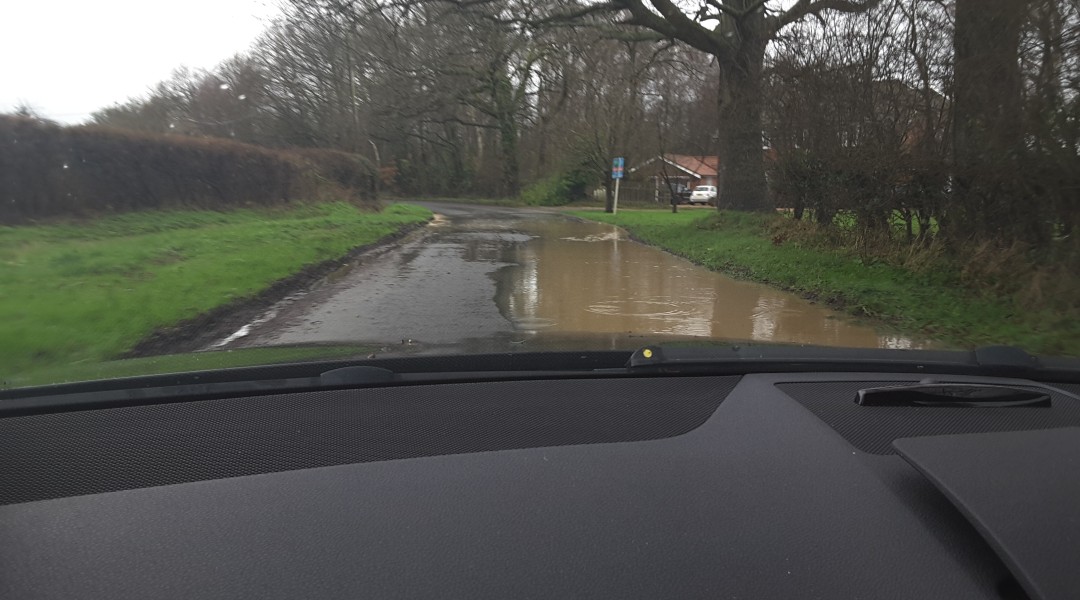
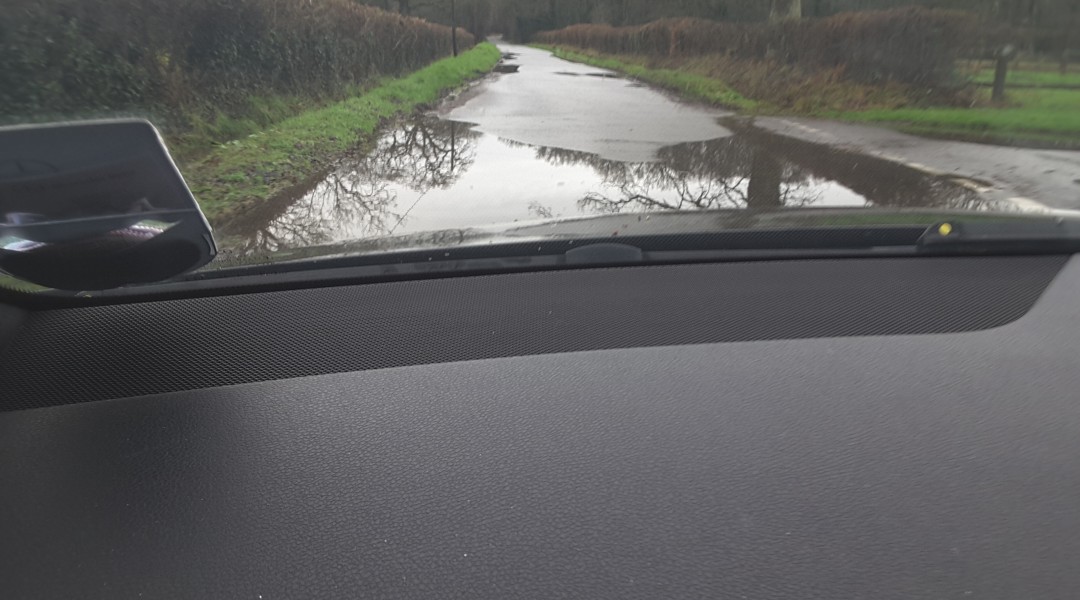
Bravehart donned his waders and took to his canoe yesterday to take pictures of the widespread floods across the country roads in Winchfield and the roads in and out of the proposed new town in Hartley Wintney, Hook and Crookham Village.

As you can see from the carousel below the floods were severe and widespread, and that is without all the surrounding green fields being concreted over.  Imagine what it would be like if the capacity of the soil to absorb water was reduced by building 5,000 houses.

Bravehart found floods in the following areas:

Winchfield, Hook, Crookham Village Floods 3 January 2016

Winchfield, Hook, Crookham Village Floods 3 January 2016

  • Church Lane, Hartley Wintney near St Mary’s Church
  • Taplins Farm Lane, near the farm and near the bridge over the M3
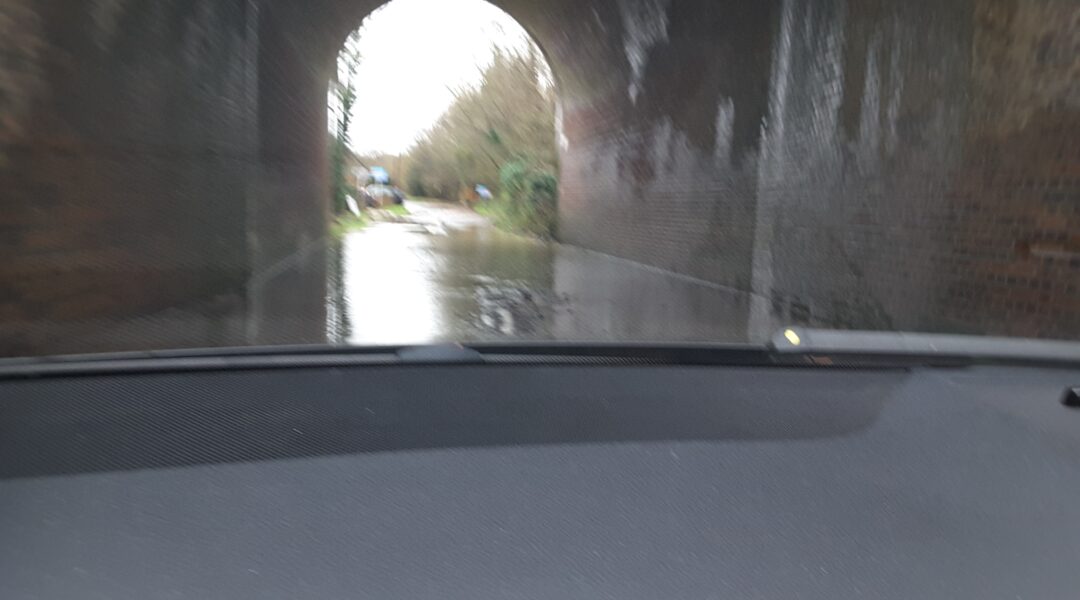
  • Taplins Farm Lane, just below the Internet car showroom, along the road through the railway tunnel up to near Hurst Farm
  • The Hurst and Pale Lane in Winchfield
  • Extensive flooding along Station Road from the Hurst to Bagwell Lane and again through the railway tunnel
  • The bottom of Bagwell Lane, Winchfield and at many places along the lane towards Odiham Common
  • Totters Lane under the M3, near the bridge over the railway and near the A30 in Hook parish
  • On the A30 between Murrell Green and Phoenix Green
  • On the B3016 Odiham Road near the junction with the A30 and under the M3
  • On Pilcot Road near the junction with Hitches Lane in Crookham Village

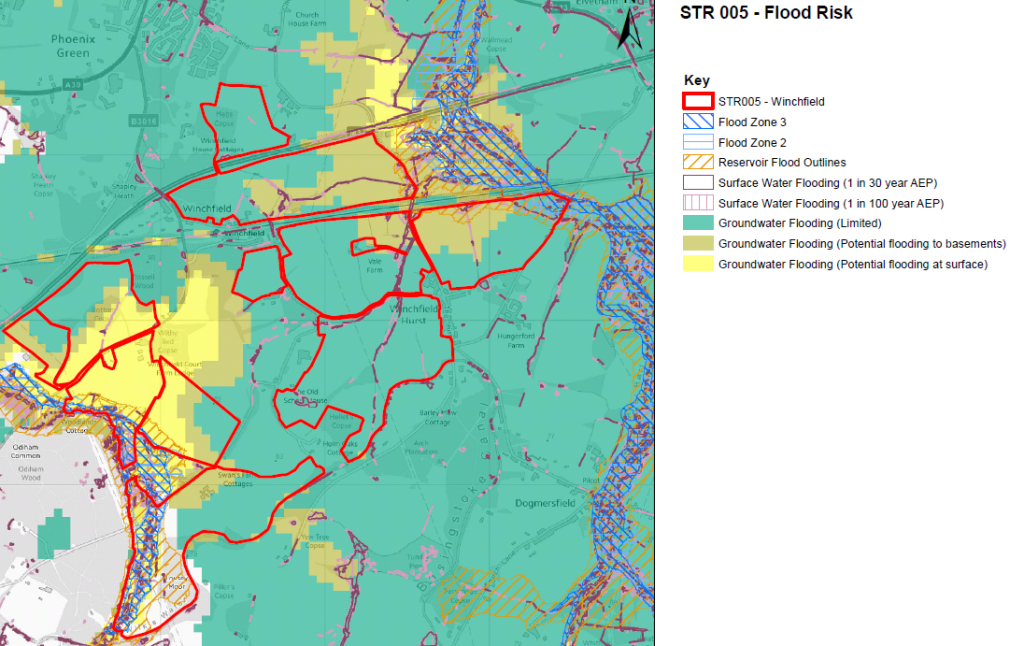
Yesterday’s events demonstrate the evidence in the site assessment that the area is very susceptible to groundwater flooding.

Winchfield Flood Risk

Winchfield Flood Risk

We find it difficult to believe that anyone can conclude that these sites and these roads are a suitable location for a new town of 5,000 houses.

[Update]

This story covered in Get Hampshire January 4 2016: Floods will worsen if green fields are concreted over for new Winchfield town, campaigners warn

And covered in Fleet News and Mail January 6 2016: Flooding proves new town idea will not float says campaigner

[/Update]

If you would like to make your voice heard and object to the new town idea, we urge you to respond to the Hart District Council consultation about the Local Plan and ask them to think again. We have created a dedicated consultation page and two guides to responding to the consultation that are available on the downloads below. The comments are designed to be cut and pasted into the boxes provided. It will be very powerful if you could edit the comments into your own words. Please do find time to respond to the consultation and play your part in saving our countryside.

Full version:

Responses to Local Plan Consultation

2 Minute version:

Respond to Local Plan Consultation in 2 minutes
Flood Church Lane Hartley Wintney 3 January 2016

Flood Church Lane Hartley Wintney 3 January 2016


Flood Taplins Farm Road Winchfield 3 January 2016

Flood Taplins Farm Road Winchfield 3 January 2016


Flood Taplins Farm Road Winchfield 3 January 2016

Flood Taplins Farm Road Winchfield 3 January 2016


Flood Potbridge Road Winchfield 3 January 2016

Flood Potbridge Road Winchfield 3 January 2016


Flood Totters Lane Hook 3 January 2016.

Flood Totters Lane Hook 3 January 2016.


Flood Bagwell Lane Winchfield 3 January 2016.

Flood Bagwell Lane Winchfield 3 January 2016.


Railway bridge at Station Road WInchfield. Floods at Winchfield, Hook and Crookham Village 3 January 2016

Railway bridge at Station Road Winchfield. Village 3 January 2016


Flood Hitches Lane/Pilcot Road Crookham Village 3 January 2016

Flood Hitches Lane/Pilcot Road Crookham Village 3 January 2016


Flood B3016 Odiham Road Winchfield 3 January 2016.

Flood B3016 Odiham Road Winchfield 3 January 2016.

Which parishes have seen most development Hart District?

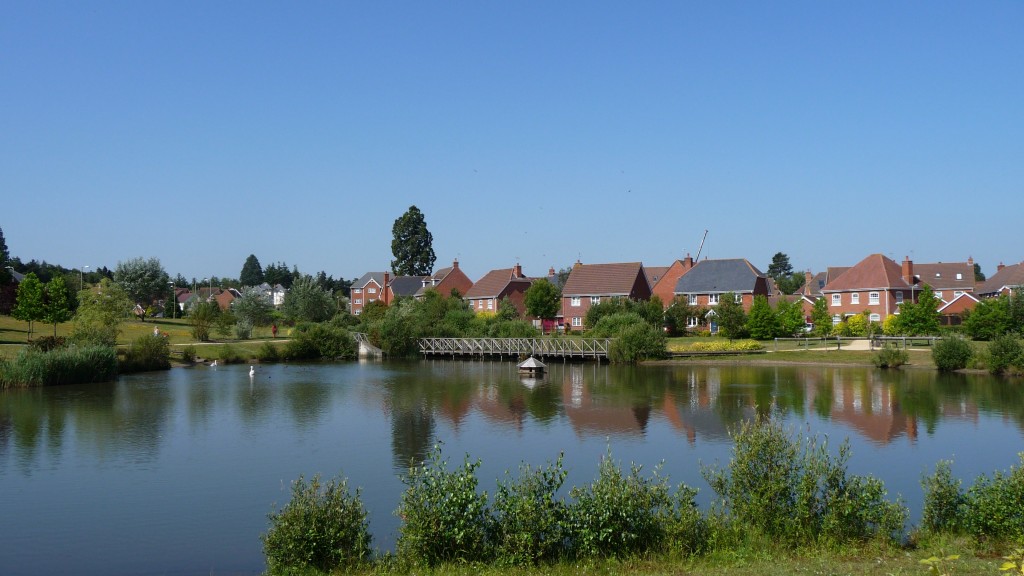
Elvetham Heath near Fleet, Hampshire

Elvetham Heath near Fleet, Hampshire

There has been much controversy about how much development there has been in Hart District over the past few years, so inspired by a post on the Winchfield Action Group site, we thought we’d take a closer look at the data.

We have compiled a list by parish and ward of the number of dwellings in each area in 2001 and 2011, according to the census and the results are shown in the table below:

ParishWard2001 Census (Dwellings)2011 Census (Dwellings)% Increase
Blackwater & Hawley177218675.4
Bramshill9863-35.7
Church Crookham330933280.6
Crondall6887387.2
Crookham Village156316304.3
Dogmersfield1241283.2
Eversley5996508.5
Ewshot2292352.6
FleetCentral2235256514.8
FleetCourtmoor188819282.1
FleetNorth (inc Elvetham Heath)13602947116.7
FleetPondtail182018984.3
FleetWest185719786.5
Fleet Total91601131623.5
Greywell1041040
Hartley Wintney212622224.5
Heckfield137135-1.5
Hook2718311114.5
Mattingley2322382.6
Odiham & Long Sutton271228806.2
Rotherwick2052123.4
South Warnborough21326223
Winchfield2392587.9
Yateley79427959.2
Total34170373369.3

It should be noted that the data only runs up to 2011 and so misses out most or all of certain developments such as QEB in Church Crookham, Dilly Lane and Rifle Range Farm in Hartley Wintney, Edenbrook and the planned new developments at Hawley Park Farm, new development to the North East of Hook and at Watery Lane.

It does show that the area with the largest increase is what was known as Fleet North, which has now been split after incorporating Elvetham Heath.

It is not really for us to point fingers at different areas of the district.  We will let readers make up their own mind and draw their own conclusions from the data.

If anyone finds an error in any of the data, then please do get in touch and we will make any corrections that are needed.

[Update]

I was asked to provide updated data of the permissions and completions since 2011.  There is no easy way to get this data.  This is a copy of what I received:

The majority of the information (with details of location and parish) on housing completions and permissions for the next few years can be found in the following two published documents :

Appendix 2&3
http://www.hart.gov.uk/sites/default/files/4_The_Council/Policies_and_published_documents/Planning_policy/Hart%205%20yr%20supply%20statement%20at%201st%20October%202015.pdf

And http://www.hart.gov.uk/sites/default/files/4_The_Council/Policies_and_published_documents/Planning_policy/Final%20Dwelling%20Completion%20Figures%202014-15_for%20website.xlsx

It’s regrettable  that you only used figures from the superseded five year land supply (2001-2011) calculation in the Interim Housing Delivery Strategy which was superseded by the Five Year Land Supply Position Statement:
Five Year Housing Land Supply Position Statement, 1st October 2015
2014-15, and the Completions list from Hampshire County Council (1st April 2015) both of which were linked on the  council website “Current planning policy and guidance” referring to the local plan consultation, and also discussed at a council meeting.

I’m glad got said you’d incorporate the latest numbers, and look forward to seeing this. I believe you’ll find disproportionate housing allocation to the North and East of the region whilst minimal development in the centre, West or south.

I can confirm that I used neither of the Housing Land Supply documents to produce the table above.  As the original post says, the source for the above is the census.

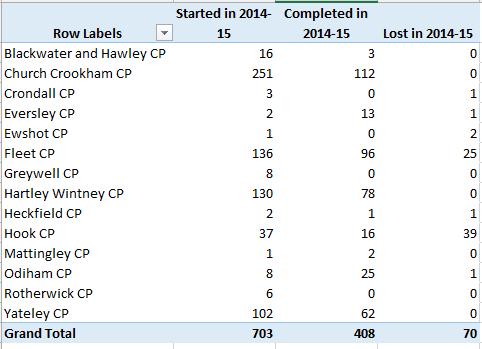
The link to the pdf just gives a long list of sites in a form that it is impossible to analyse in any meaningful way, least of all by parish.  The spreadsheet contains a list of starts, completions and losses for 2014-2015, a summary of which by Parish is shown below.

Dwellings started completed and lost in Hart District 2014-15

[/Update]

Impact of a new town on Fleet and Church Crookham

Fleet and Church Crookham

Impact of new town on Fleet and Church Crookham

I have a great deal of sympathy for residents of Fleet and Church Crookham who have suffered a great deal of development in recent years with insufficient investment in infrastructure.  However, a new town in Winchfield, Hook and Hartley Wintney parishes is not the panacea for Fleet residents that that many of the Hart Councillors would have you believe.
There will be negative impacts in 4 main ways:

  • Starvation of infrastructure funding
  • Extra traffic and congestion
  • Lack of affordable homes
  • Destruction of amenity space

Infrastructure Funding

Hart Council currently has a £78m infrastructure funding deficit, much of it in Fleet, Church Crookham and Hook. This does not include healthcare where there is a forecast £47m funding deficit in five years time.  A new town will need about £300m of infrastructure spending to make it work, but a realistic assessment of developer contributions is £40-50m.  This leaves a further gap of ~£250m.  There are already complaints about long waiting lists at doctors and lack of other amenities.  It is clear that a new town will be under-funded with consequent impact on other parts of Hart District, where there will be no spare money to address the deficit that already exists in all areas of Hart including Fleet and Church Crookham.


Congestion

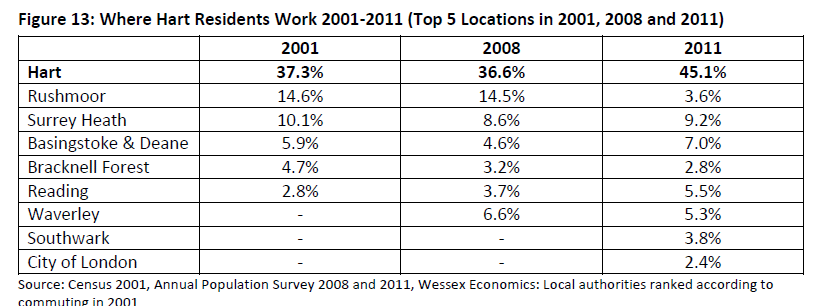
Where Hart Residents Work

Where Hart Residents Work, SHMA Figure 13

Let’s have a look at where Hart residents work, using the evidence of the Strategic Housing Market Assessment (SHMA).

A bit less than half of them work in Hart – 45%. So of the 12,500 new people in a new town, 45% of those of working age will work in Hart. The biggest employment centres are in Fleet and Hook. So a significant proportion of the new town workers will go to work in Fleet. They are not all going to work in a new supermarket in the new town.

A significant proportion will also work in Rushmoor (Farnborough and Aldershot), Surrey Heath (Camberley) and Waverley (Farnham) – some 18% in total.

The most obvious travel to work route for many of these people will be along Pale Lane, through Elvetham Heath/Fleet or along Chatter Alley, through Dogmersfield, Crookham Village and Church Crookham.  But these roads are narrow and a difficult to upgrade due to bridge constraints, so maybe a new road out of the new town on to Hitches Lane will be required.

A big portion – 6.2%, will use the train to go up to London from a station that is already full, on a line that is operating at or above design capacity.

Another group will go to Hook directly, or through Hook and/or Hartley Wintney to get to Reading or Bracknell adding to existing peak time congestion on the A30.

Pretending a new town will have no impact on congestion in Fleet and the Crookhams is plainly wrong.

Surely much better and more sustainable to direct housing development to the east of Fleet at Ancells Farm, Bramshott Farm and Pyestock (some of them brownfield sites) with a cycle route to Fleet station and a cycle route to the Cody Tech centre or the Farnborough airport complex.

Affordable Housing


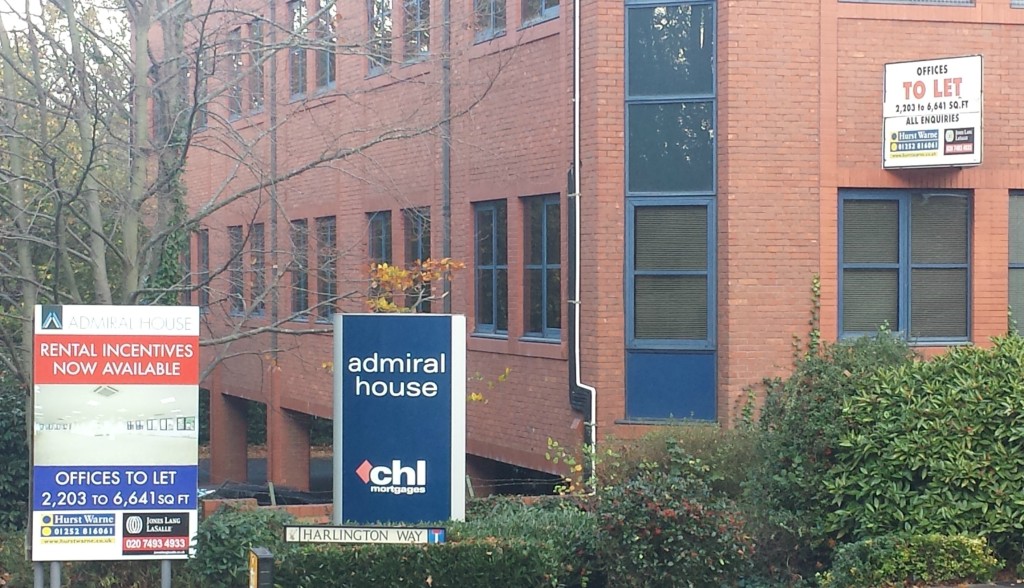
Vacant Office Admiral House, Harlington Way, Fleet, Hart District, Hampshire

Admiral House, Harlington Way, Fleet, Hart District, Hampshire

As of 26/11/15, the cheapest 1-bed and 2-bed new homes available within 1 mile of Fleet are available at prices of £215,000 and £235,000 (Rightmove). Median household incomes for Hart are £40,200 per Figure 4.8 of the SHMA. This means that the cheapest new homes are between 5.3 and 5.8 times median incomes and out of reach for the average household, so something should be done.

The SHMA calls for 60-70% of new build to be 1 and 2-bed properties across the Housing Market Area.  The developers are going to want to do what they always do, that is to build 3-5 bedroom detached houses in the new town which will be no doubt attractive to those moving from London, but will do nothing to meet the needs of ordinary people living in Hart.

Surely, it would be better to build smaller, starter properties on brownfield sites such as Ancells Farm, Fleet Road, Harlington Way in Fleet and Bartley Wood in Hook to give younger people a more affordable first step on the housing ladder.  This iwll do far more to meet the actual need outlined in the SHMA, and be more sustainable for our environment.

Destruction of amenity space

The Heart of Hart, the area around Winchfield, is used as an amenity area for walking, cycling, watching wildlife and other recreation. Concreting it over and joining together Hartley Wintney, Winchfield and Hook into a giant Hartley Winchook conurbation will lead to lack of amenity for everyone.  Hart Council is yet to report on the consultation it ran earlier this year on how we value our amenity space.

If you are concerned about the impact of a new town, we have created two guides to responding to the consultation that are available on the downloads below. The comments are designed to be cut and pasted into the boxes provided.  It will be very powerful if you could edit the comments into your own words. Please do find time to respond to the consultation and play your part in saving our countryside.

Full version:

Responses to Local Plan Consultation

2-minute version:

Respond to Local Plan Consultation in 2 minutes

Lock, stock and two smoking barrels

I present without further comment the contents of a letter I sent to Hart District Council yesterday (Friday 20 November 2015). Please do get involved with this consultation and respond to it using our guide on our dedicated page about this consultation here.

Errors, omissions and anomalies in the (Strategic Housing Land Availability Assessment) SHLAA and consultation materials

Dear Messrs Daryl Phillips and Stephen Parker,

It is clear that Hart Council has been very busy, publishing a vast array of new material about the SHLAA and the materials to be used in the forthcoming consultation about Housing Options.  I have burned a considerable amount of midnight oil going through those materials in some detail, and I have identified material errors, omissions and anomalies that give me serious cause for concern that I would like to share with you.  The Excel workbook containing the amalgamation of the SHLAA Master List, the NHB data and the SHLAA detail is attached for reference. These fall into several broad categories:

  • Assessment of brownfield site capacity and delivery
  • Deliverable and developable sites not included in the Developing a Local Plan for Hart paper (DLP) nor the New Homes Sites Booklet (NHB)
  • Sites missing from NHB but in the SHLAA
  • Discrepancies between capacity shown in NHB compared to SHLAA detail
  • Sites shown in detailed assessment but not in master list
  • Sites assessed as “not currently developable”, but have been granted planning permission
  • Range of meanings of “not currently developable”
  • Lack of consideration of the economic aspects of housing options 
  1. Assessment of brownfield site capacity and delivery.

There are a number of components to this:

In Hart News in September, and again at cabinet on 1 October, it was said that brownfield capacity had increased to 1,800 units. Now, this has miraculously fallen by 75% to 450 units on some dubious grounds. First, para 41 of the DLP states correctly that years 6-10 need only “developable” sites to be included, beyond that you can be more vague about sites.  We are already 4 years into the plan period and, according to the land supply calculation based on the current inflated SHMA, we have 5.7 years of land supply.  Yet, you are only selecting sites to be included in your calculations that meet the most onerous criterion of being “deliverable”.  As you know I have two FOI requests outstanding with you, the first is inquiring about the disposition of the 750 brownfield units that we were told were achievable back on November 2014, and the second asking for the analysis to support the 1,800 figure.  It seems to me you have inappropriately applied criteria that are too onerous in order to artificially reduce the potential brownfield capacity.  An example of this would be excluding Bramshill, when everyone knows it will be preferable for this site to undergo some sort of redevelopment to stop the Grade 1 listed building decaying and of course the hideous 1970’s accommodation blocks need replacing too.

You have under-stated the brownfield capacity in the DLP, compared to the assessed capacity in the SHLAA documents. This is shown in the table below:

Parish/Ref Sum of Site Assessment Capacity (Low) Sum of Site Assessment Capacity (High) Sum of Brownfield Capacity in Table 1 in DLP doc
Blackwater and Hawley 320 320 300
SHL100 320 320 300
Church Crookham 6 6 8
SHL28 6 6 8
Elvetham Heath 45 45 45
SHL104 45 45 45
Fleet 221 221 83
SHL113 12 12 17
SHL245 8 8 14
SHL320 150 150 20
SHL322 37 37 17
SHL41 6 6 6
SHL42 8 8 9
Grand Total 592 592 436


This shows that the capacity shown in the DLP (excluding the 20 units from the sites with planning permission) is some 156 units lower than your own assessments in the SHLAA documents with most of the discrepancy arising from sites SHL320 & 322.  Correcting this would reduce the net requirement by 156 units.

In Figure 2 of the DLP, you assert that 52% of the development completed or where permission has been granted since 2011 is on brownfield sites. Yet at September Council, a question was asked along similar lines and the response was “these figures exclude brownfield sites that require planning permission, because those are not currently split between greenfield and brownfield developments”.  This leads one to conclude either that you have simply made up the figures in the DLP, or you knowingly misled the Council and the public in September.  Which is it?

  1. Deliverable and developable sites not included

[updated with this note]

There’s a large number of deliverable and developable sites that are in the SHLAA but not apparently referred to in the DLP or the NHB.  A list if these is shown in the table below (some of which are in the NHB):

Parish/Ref Sum of NHB Capacity Sum of Site Assessment Capacity (Low) Sum of Site Assessment Capacity (High)
Blackwater and Hawley 320 320
SHL100 320 320
Church Crookham 6 6
SHL28 6 6
Elvetham Heath 45 45
SHL104 45 45
Fleet 25 243 248
SHL113 12 12
SHL245 8 8
SHL275 25 12 17
SHL320 150 150
SHL322 37 37
SHL41 6 6
SHL42 8 8
SHL69 10 10
Hartley Wintney 6 6
SHL95 6 6
Hook 550 550
SHL1&2 550 550
South Warnborough 16 16 16
SHL172 16 16 16
Grand Total 41 1,186 1,191

The land supply document shows a total of 3,878 units built, permitted or deliverable up until 1 April 2015, some 722 below the 4,600 figure you assert in the DLP.  I accept that 340 units from SHL1 & 2 and 10 from SHL69 are included in the land supply.  But the land supply does not include 300 units from Watery Lane.  Netting all of this off, then there are around 5,000 units already accounted for by being completed, permitted or deliverable, which would reduce the current net requirement by ~400 units compared to what you assert in the DLP.

  1. Sites missing from NHB but in the SHLAA

There are 76 units on sites in the SHLAA that are not already on the brownfield list and not strategic sites that do not appear in the NHB.  These are shown in the table below:

Parish/Ref Sum of NHB Capacity Sum of Site Assessment Capacity (Low) Sum of Site Assessment Capacity (High)
Fleet 10 10
SHL69 10 10
Hartley Wintney 6 6
SHL95 6 6
Heckfield 5 5
SHL157 5 5
Mattingley 48 48
SHL160 48 48
Yateley 7 7
SHL18 7 7
Grand Total 76 76


This raises the question as to why these sites have not been included in the NHB process either as selected or rejected sites.


  1. Discrepancies between capacity in NHB and SHLAA

There are material discrepancies between the site capacities shown in the NHB and those in the SHLAA.  Sometimes the NHB can be above the SHLAA figures and sometimes below.  But overall, adding up all of the sites where the NHB capacity is outside the range of SHLAA lower and upper limits, the NHB shows a lower capacity of some 1,500 units.  This demonstrates that the potential capacity of dispersal sites is being materially under-stated.  These sites are shown in the table in Appendix 1.


  1. Sites present in the detail of the SHLAA but not on the master list, and hence not in the NHB, nor mentioned in the DLP.

There are three sites, SHL167, 168 and 169 appear in the detailed assessments of sites, but not on the master list.

  1. Sites shown as “not currently developable” but have in fact been granted planning permission

Sites SHL68 and SHL117 are listed in the detail SHLAA documents as “not currently developable”, but according to the master list of sites have been granted planning permission.

  1. Range of meanings of “not currently developable”

It is clear from the above that the term “not currently developable” is a somewhat elastic phrase that can include sites that are just an administrative stroke of the pen away from deliverability as well as sites that face very significant challenges.  Many sites in the NHB and of course many of the strategic sites face very significant challenges that it is difficult to see how they can be remedied, such as proximity to flood zones, SSSI’s, SINCs, TPOs and the SPA and lack of proximity to existing settlements whereas others are much closer to deliverability.

However, the main materials being circulated for the consultation do not make this distinction clear.

  1. Lack of discussion about economics

The discussion about infrastructure costs in the DLP, with the only mention of costs being the woefully [inadequate] £30m for a new motorway junction – I would think there is little chance of change out of £100m.  But even so this misses out other important infrastructure items like the local road system, new or upgraded railway station, widening of the railway bridges over the local roads, new sewage farm, burying overhead power lines, new schools and new healthcare facilities to name but a few.  Hart currently has a £78m infrastructure funding deficit, Hampshire as a whole £1.9bn and the local NHS is predicted to have a large annual funding deficit.

These issues associated with a new town should be spelled out in detail, and I would think many of the same issues will arise with urban extensions.

It is certainly true that these issues will need to be resolved before the Local Plan can be found sound at examination.

So, what are we to conclude from the above?  First, the discrepancies outlined above, once corrected will make a very material difference to the calculation of how many more houses we need to build on green field sites (if any) and the capacity of each parish to deliver them.  I do not wish to subscribe to conspiracy theories.  However, the sum-total of the above, coupled with the obvious single-minded desire on the part of some members to push through a new town at all costs, leads me to conclude that either the people who created these consultation documents were incompetent or they are by their omission or intent about to mislead the public.   It is also clear that whatever systems and processes you are using to plan, manage, monitor and control the SHLAA are completely inadequate with such large discrepancies between different views of the same data.

It is clear to me that the forthcoming consultation should be postponed until these discrepancies are ironed out.

I would like you to treat this letter as a formal complaint and respond according to LGO guidelines.  I might also add that I will copy this letter to the chairman of the Standards Committee to ask him to set up an investigation and to our Local MP.  You might expect this letter and your response to be presented as evidence in any examination of the Local Plan.

Yours sincerely,


cc:           Peter Kern, Chairman of Hart DC Standards Committee

Ranil Jayawardena, MP


Appendix 1:

Parish/Ref Sum of NHB Capacity Sum of Site Assessment Capacity (Low) Sum of Site Assessment Capacity (High)
Blackwater and Hawley 15 12 12
SHL21 15 12 12
Bramshill 300 250 250
SHL106 300 250 250
Crondall 112 130 130
SHL159 65 100 100
SHL72 16 18 18
SHL76 31 12 12
Crookham Village 70 100 100
SHL53 70 100 100
Dogmersfield 40 5 10
SHL39 40 5 10
Eversley 91 123 123
SHL127 50 70 70
SHL140 41 53 53
Ewshot 120 187 187
SHL174 63 105 105
SHL355 48 75 75
SHL80 9 7 7
Fleet 706 881 886
SHL102 43 45 45
SHL275 25 12 17
SHL333 500 750 750
SHL50 46 60 60
SHL51 92 14 14
Hartley Wintney 208 287 301
SHL155 117 194 194
SHL216 8 6 6
SHL35 34 3 17
SHL45 25 51 51
SHL91 10 11 11
SHL97 12 10 10
SHL99 2 12 12
Heckfield 169 45 65
SHL109 44 5 5
SHL257 62 20 30
SHL259 63 20 30
Hook 2,090 3,849 3,849
SHL123 13 20 20
SHL3 543 1,000 1,000
SHL4 458 1,800 1,800
SHL5 1,065 1,000 1,000
SHL6 11 29 29
Long Sutton 63 65 65
SHL296 6 5 5
SHL335 34 35 35
SHL336 23 25 25
Mattingley 130 40 60
SHL239 55 20 30
SHL240 75 20 30
Odiham 3,308 2,894 2,904
SHL108 387 160 160
SHL110 2,160 1,900 1,900
SHL138 204 261 261
SHL228 48 75 75
SHL29 10 6 6
SHL328 25 30 30
SHL329 44 30 30
SHL57 47 75 75
SHL59 115 175 175
SHL60 11 12 12
SHL65 36 50 50
SHL67 53 80 80
SHL78 168 40 50
Rotherwick 130 200 200
SHL86 130 200 200
South Warnborough 36 20 25
SHL70 7 5 5
SHL75 29 15 20
Winchfield 119 32 42
SHL114 11 12 12
SHL262 108 20 30
Yateley 9 60 60
SHL13 0 8 8
SHL149 0 10 10
SHL17 0 30 30
SHL303 9 12 12
Grand Total 7,716 9,180 9,269

See more at our consultation page:

link
New houses near Winchfield station will increase congestion

New houses lead to traffic congestion in Hart District

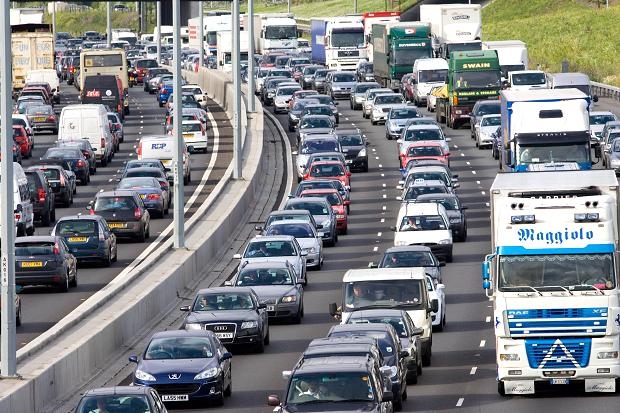
Example of traffic congestion that could happen in Winchfield

A new study by the Royal Town Planning Institute (RTPI), has shown that adding houses near railway stations in country areas could see a massive increase in car journeys each week to create additional congestion and delays on roads that are already overloaded.  Of course there is a direct read across from the RTPI analysis to Hart Council’s proposals for a new town at Winchfield, that would inevitably impact Hartley Wintney, Hook, Odiham, Dogmersfield, Crookham Village, Church Crookham and Fleet.

We can estimate how many extra traffic movements there might be from a 5,000 house new town at Winchfield by looking at the Hampshire County Council transport contributions policy.  They estimate 7 trips per average dwelling per day, which would lead to an extra 7 x 5,000 = 35,000 trips per day or 12.8m extra trips per annum on both minor country roads and our already congested wider road network.

Janet Askew, President of the Royal Town Planning Institute (RTPI), said:

“Quite apart from other good reasons why building in the green belt on such a scale might be opposed, these figures demonstrate a fundamental flaw in the reasoning that there is a quick fix and a sustainable solution to the housing crisis by putting large numbers of new homes close to railway stations.”

The RTPI press release went on to say:

“The view of the RTPI is that brownfield sites should be looked at as a priority for housing but not all brownfield sites will be suitable. The housing crisis is complex and will require a number of different policy solutions, such as increasing access to mortgage finance, improving transport and infrastructure, encouraging the house builders to build more homes, and a strong, delivery focussed planning system. Major proposals for new homes, whether they are in the green belt or on brownfield sites, must be preceded by adequate investment in schools, health, transport and other infrastructure, and planned in a strategic and holistic way, with up to date local plans being critical.”

Of course this is consistent with what We Heart Hart has been saying for many months, but Hart Council will not consider adding a brownfield development option into the Local Plan process; won’t look at our alternative 5-point plan and won’t even establish a register of brownfield sites.

The full text of the RTPI press release is shown below:

Using commuting data from  the 2011 Census the Royal Town Planning Institute (RTPI), has today published analysis which finds that adding 1 million homes near railway stations in the Metropolitan London green belt area could see 3.9-7.5 million car journeys each week added to roads which are already struggling with congestion and delays. These findings – Building in the green belt? A report into commuting in the Metropolitan green belt challenge the assumption that building in the green belt around railway stations would see the majority of new residents using the train to get to jobs in London and could therefore be easily accommodated.

Over the past year various think tanks, academics and policy commentators have considered whether green belt boundaries around London should be relaxed in order to ease the housing crisis. These proposals often suggest the release of green belt land within easy walking or cycling distance of key railway stations, land which could provide space for figures upwards of 1 million homes. The assumption behind these proposals is that the majority of new residents will commute by rail to jobs in central London, enabling sustainable housing growth in the wider Metropolitan region without placing excessive strain on existing roads. However the implications of growth on commuting patterns is difficult to predict without looking at those already living in the green belt. Where are these residents travelling for work, and what methods of transport are they using to get there?

The RTPI examined commuting data for five medium-sized towns within the existing Metropolitan green belt, towns which are centred around railway stations and have direct connections to central London. We found that in these five towns, only 7.4% of commuters actually travel to inner London by train on a regular basis, despite living within easy walking or cycling distance of a station. The majority of commuters (72%) instead travel by private vehicle, mostly driving to jobs within their hometown and to other places not in London.

Janet Askew, President of the Royal Town Planning Institute (RTPI), said:
“If 1 million new homes were built in the green belt in this way, this is likely to result in a huge increase in the number of car journeys being made across the green belt to work, and between schools health facilities and stations”.
“Quite apart from other good reasons why building in the green belt on such a scale might be opposed, these figures demonstrate a fundamental flaw in the reasoning that there is a quick fix and a sustainable solution to the housing crisis by putting large numbers of new homes close to railway stations. While it is difficult to predict exactly future commuting patterns, the overwhelming evidence is that people will use their cars and this will result in vastly increased numbers of car journeys in and through the green belt.”

Trudi Elliott, Chief executive of the Royal Town Planning Institute (RTPI), said:
“The outcome of the analysis was surprising given the range of voices calling for housing around railway stations in the green belt. Our data shows, using one region of the green belt, just how complex the issue of commuting patterns is and how unpredictable they are likely to be in the future. The green belt is an important planning tool. Our findings demonstrate that it is vital to have an evidence base before you make major policy.”

The view of the RTPI is that brownfield sites should be looked at as a priority for housing but not all brownfield sites will be suitable. The housing crisis is complex and will require a number of different policy solutions, such as increasing access to mortgage finance, improving transport and infrastructure, encouraging the house builders to build more homes, and a strong, delivery focussed planning system. Major proposals for new homes, whether they are in the green belt or on brownfield sites, must be preceded by adequate investment in schools, health, transport and other infrastructure, and planned in a strategic and holistic way, with up to date local plans being critical. Any development in the green belt continues to need rigorous justification under the planning system and there are many checks and balances in place.

The five towns in the RTPI analysis were: Hemel Hempstead, High Wycombe, Watford, Maidenhead and Bracknell.

The RTPI is also publishing today a short YouTube film and a new public information note explaining the history, background and purpose of the green belt. A recent Ipsos Mori poll found 71% of all age groups knew just a little/ heard of but know nothing/never heard of green belt land. Among the under 34s this was 85% and among the under 24s the figure was 92%.

Please help Hart fend off an extra 1,600 houses from Rushmoor

Is this what we want Hart to turn into?

Is this what we want Hart to turn into?

Rushmoor Borough Council has published a draft Local Plan where it proposes to build only 8,200 of its assessed need of 9,822 houses over the plan period.  It is clear that Rushmoor is seeking to offload the remaining 1,622 houses on to Hart District.

We need to oppose this move and We Heart Heart have produced some materials to help you do this easily.  Our voice will have greater weight if we can get more Hart residents to comment on Rushmoor’s plan than Rushmoor residents. Please follow the simple process below:

  1. Download the Local Plan response form from the link below.
  2. On page 3, fill in your name and contact details and type your name and date in the boxes at the bottom of the page.
  3. Review the comments made and feel free to add, amend or delete as you see fit.
  4. Save the document, attach it to an email and send to [email protected]
  5. Share a link to this page to all your friends and family as well as any sports clubs or community groups you belong to via word of mouth, email, Facebook and Twitter and ask them to put in a response and share this page again.
  6. If you have not already done so, please sign and share our petition too.
Rushmoor Local Plan Response Form

A summary of the arguments we are putting forwards is outlined below.

Slippery slope to taking more housing than the other districts

The proposal to take an additional 1,622 houses from Rushmoor puts us on the slippery slope to accepting a further 1,400 houses from Surrey Heath such that Hart District ends up having to build the most houses in the Housing Market Area.


Hart DistrictSurrey Heath BoroughRushmoor BoroughTotal Housing Market Area
Original SHMA7,5347,0579,82224,413
Proposed Transfers3,022(1,400)(1,622)0
New Total10,5565,6578,20024,413


This will impact all of our districts including Blackwater and Hawley; Bramshill;  Church Crookham; Crondall; Crookham Village; Dogmersfield; Elvetham Heath; Eversley; Ewshot; Fleet; Greywell; Hartley Wintney; Heckfield; Hook; Mattingley; North Warnborough; Odiham; Rotherwick; South Warnborough; Winchfield; and Yateley adding additional pressure to an already difficult situation and make it more likely we have to accept both a new town and urban extensions on our beautiful green fields and countryside.

Hart and the rest of Housing Market Area are being asked to build too many houses

The whole Housing Market Area (HMA) should reduce the assessed need by 7,800 units which would reduce the pressure on Hart directly and remove the need for Surrey Heath and Rushmoor to ask us to build >3,000 houses for them. This is discussed in more detail here.

Rushmoor isn’t making best use of its brownfield sites

This is discussed in more detail here and here. As can be seen, if Rushmoor gets more creative with Wellesley and plans to build on the sites it has already identified, there is potential capacity for over 30,000 dwellings, more than three times its (overblown) assessed need.   It surely cannot be too much to expect them to find the 1,600 houses they say they can’t build out of this wealth of opportunity.  Rushmoor Borough Council should re-visit its planned densities and seek to meet all of its assessed need within in its own boundaries.  It could then make some sites available for neighbouring rural districts in line with a recent survey of Hampshire residents seeking to protect rural areas.  Neighbouring districts could be approached to provide SANG capacity if required.  Rushmoor should also take a closer look at all the vacant sites in the district and seek to convert them to residential use.

Rushmoor’s Employment Land Review is overblown and seeks to protect more employment land than is necessary.

This is discussed here.  It is also clear that past forecasts got it wrong as evidenced by the large number of vacant office blocks and empty shops across Hart District.  If the ELR was reduced to more sensible levels they could free up more land for housing.

Indeed, even if you accept the overblown employment forecasts, there will be a surplus of nearly 600K sq m of employment space at the end of the plan period, covering around 195 Ha.  Yet Rushmoor seeking to protect 96 Ha of land whilst asking Hart to build 1,600 houses on green fields.

Rushmoor’s infrastructure plans are not credible

We posted here that Hampshire as a whole has a £1.9bn infrastructure funding deficit, with Rushmoor’s share of that being £80m.  Rushmoor makes no mention of this deficit in its draft Local Plan.  Hart’s own numbers show an infrastructure deficit of £78m.  All of these numbers are probably an under-statement given they were all produced before the scale of development now proposed was known.  This is in contravention of NPPF para 177 that says there must be a “reasonable prospect” of delivering the required infrastructure alongside housing:

“It is equally important to ensure that there is a reasonable prospect that planned infrastructure is deliverable in a timely fashion. To facilitate this, it is important that local planning authorities understand district-wide development costs at the time Local Plans are drawn up. For this reason, infrastructure and development policies should be planned at the same time, in the Local Plan”

Finally, they don’t even attempt to quantify the extra infrastructure Hart would need to build the extra 1,600 houses nor do they make any offer to fund any of that extra cost.

Rushmoor not planning to meet the needs of the ageing population

Figure 10.15 of the SHMA sets out the need for specialist housing and registered care places for the HMA and Rushmoor.  This states Rushmoor must build 710 sheltered and extra care units as well as provide an extra 600 registered care places. Their draft Local Plan makes no mention of the extra registered care places and sets no target for the sheltered and extra care units.  This is in contravention of NPPF para 50 which states:

“local planning authorities should…plan for a mix of housing based on current and future demographic trends, market trends and the needs of different groups in the community (such as, but not limited to, families with children, older people, people with disabilities, service families and people wishing to build their own homes)”

Therefore the Rushmoor draft Local Plan runs the risk of being found unsound and should be revised.


In conclusion, the Rushmoor draft Local Plan contains many serious flaws and needs to be revised.

Link
 

Launch of We ♥ Hart Petition

The We Heart Hart Campaign (aka We Love Hart and We ♥ Hart) have now started a campaign on 38 degrees to petition Hart Council to change its approach to the Hart Local Plan. This petition can be found here: https://you.38degrees.org.uk/petitions/we-hart.

Please support this petition by signing it and sharing it with all your friends via e-mail, Facebook and Twitter.
We need to protect all of our parishes including: Blackwater and Hawley; Bramshill;  Church Crookham; Crondall; Crookham Village; Dogmersfield; Elvetham Heath; Eversley; Ewshot; Fleet; Greywell; Hartley Wintney; Heckfield; Hook; Mattingley; North Warnborough; Odiham; Rotherwick; South Warnborough; Winchfield; and Yateley from this invidious plan.

We Heart Hart Campaign Logo

We Heart Hart Campaign Logo

Hart District

Hart is a beautiful district made up of a mixture of large urban settlements such as Fleet and smaller village type settlements such as Odiham. The space around these settlements is largely made up of green fields and woodland which give Hart its essential rural feel.

In December 2014, for the fourth year running, Hart was named the best place to live in the country in a survey by the Halifax. Each settlement has a distinctive community feel; the quality of the schools is excellent and the 84 square miles of green fields and wooded landscape are a perfect example of England’s green and pleasant land that is excellent for wildlife, cycling and walking.

This essential nature of Hart is now being put under pressure by the National Planning Policy Framework and Hart Council’s response to it. In the years up to 2031, Hart has to build another 7,500 homes. Hart Council is proposing to meet the bulk of this need by building a new settlement in the heart of Hart at Winchfield destroying over 700 acres of green fields and woodland in the process.

We are mounting a campaign against these proposals because we believe the Strategic Housing Market Assessment that gave rise to the need for 7,534 extra houses (not to mention the extra 3,100 houses from Surrey Heath and Rushmoor) is flawed and Hart’s response to this is inappropriate.

This is putting all of the parishes of Hart District at risk including:

Blackwater and Hawley; Bramshill;  Church Crookham; Crondall; Crookham Village; Dogmersfield; Elvetham Heath; Eversley; Ewshot; Fleet; Greywell; Hartley Wintney; Heckfield; Hook; Mattingley; North Warnborough; Odiham; Rotherwick; South Warnborough; Winchfield; and Yateley.