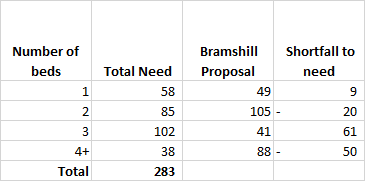
We have now received the data from Hart District Council to show how many properties have been built or permitted since 2011 by the number of bedrooms. This shows that we have built only about half of the number of 1-bed properties we need and we haven’t built enough 3-bed properties. We have built nearly twice as many 4+bed properties than we need.
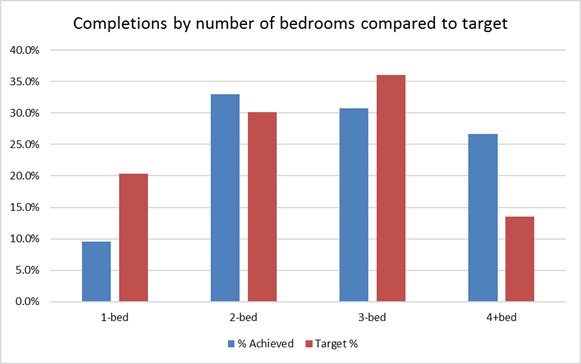
Hart District Housing completions by number of bedrooms compared to target
Outstanding permissions show that we will continue to over-build 4+bed properties and under-build 3-bed properties, although we will build about the right proportion of 1 and 2-bed properties.
This shows that of the remaining homes we need to build to meet our overall target of 7,534 homes, we need to increase the proportion of smaller 1, 2 and 3-bed properties to meet the needs of local people.
Overall we think that Hart Council needs to get smarter about how it monitors planning permissions so the Hart Local Plan gets as close as possible to meeting the needs of local people set out in the SHMA, as opposed to simply building houses that will maximise developer profits. It is also clear that we need to keep up the focus on brownfield development as that is much more likely to deliver more of smaller properties we need to help the younger generation on to the housing ladder.
The analysis to support these conclusions is shown below.
First, according to the current Strategic Housing Market Assessment (SHMA), Hart needs to build 7,534 dwellings in the plan period running from 2011-2032. The SHMA is also very clear on the sizes and types of housing that needs to be built, including the number of affordable homes for the young and specialist housing for the elderly.
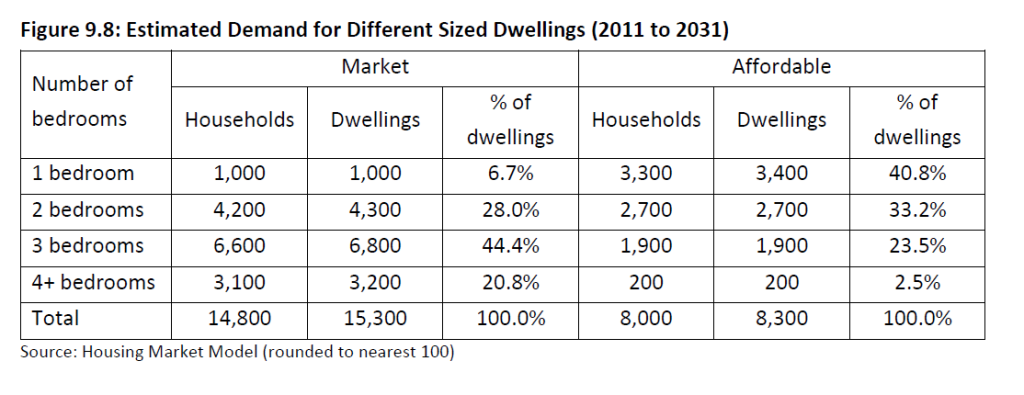
Hart Surrey Heath and Rushmoor SHMA Figure 9.8
Working through the arithmetic, and using HArt’s target of 40% affordable homes, we need to build in total the following number and proportion of properties by number of bedrooms:
| Target Housing Need by number of bedrooms |
| Number of beds |
1-bed |
2-bed |
3-bed |
4+bed |
Total |
| % need as affordable |
40.8% |
33.2% |
23.5% |
2.5% |
100.0% |
| % need as market |
6.7% |
28.0% |
44.4% |
20.8% |
100.0% |
| Affordable Need |
1,230 |
1,001 |
708 |
75 |
3,014 |
| Market Need |
304 |
1,267 |
2,008 |
941 |
4,520 |
| Total Need |
1,533 |
2,268 |
2,717 |
1,016 |
7,534 |
| % Total Need |
20.4% |
30.1% |
36.1% |
13.5% |
100.0% |
We can compare these proportions to the dwellings that have been built since 2011:
| Gross Completions by year and number of bedrooms |
| Year |
1-bed |
2-bed |
3-bed |
4+bed |
Grand Total |
| 2010-11 |
35 |
43 |
14 |
25 |
117 |
| 2011-12 |
58 |
159 |
79 |
39 |
335 |
| 2012-13 |
5 |
42 |
92 |
96 |
235 |
| 2013-14 |
4 |
91 |
94 |
84 |
273 |
| 2014-15 |
22 |
94 |
121 |
103 |
340 |
| Grand Total |
124 |
429 |
400 |
347 |
1,300 |
| % of Total |
9.5% |
33.0% |
30.8% |
26.7% |
100.0% |
| Target % |
20.4% |
30.1% |
36.1% |
13.5% |
|
This shows that we have built less than half of the proportion of 1-bed properties and have built nearly twice as many 4+bed properties compared to the target.
If we now look at the outstanding planning permissions, we can see there are over 3,000 dwellings permitted but not yet built as at 20 April 2016:
| Gross Outstanding permissions by year of decision and number of bedrooms |
| Year |
1-bed |
2-bed |
3-bed |
4+bed |
Grand Total |
| 2003-4 |
4 |
|
1 |
|
5 |
| 2004-5 |
|
|
1 |
|
1 |
| 2006-7 |
1 |
|
|
|
1 |
| 2008-9 |
|
|
|
1 |
1 |
| 2009-10 |
|
1 |
|
1 |
2 |
| 2010-11 |
1 |
3 |
5 |
5 |
14 |
| 2011-12 |
4 |
13 |
22 |
23 |
62 |
| 2012-13 |
68 |
115 |
234 |
176 |
593 |
| 2013-14 |
132 |
207 |
78 |
58 |
475 |
| 2014-15 |
140 |
302 |
274 |
242 |
958 |
| 2015-16 |
273 |
309 |
221 |
166 |
969 |
| 2016-17 |
|
-1 |
2 |
4 |
5 |
| Grand Total |
623 |
949 |
838 |
676 |
3,086 |
| % of Total |
20.2% |
30.8% |
27.2% |
21.9% |
100.0% |
| Target % |
20.4% |
30.1% |
36.1% |
13.5% |
|
This shows the outstanding permissions will deliver about the right proportion of 1 and 2-bed properties, but not enough to make up the shortfall of those already built and will continue to under-build 3-bed properties and over-build 4+bed properties.
The data does not show the proportion of open-market versus affordable housing, nor does it show the proportion of specialist homes for the elderly. Overall we think this means that Hart needs to get smarter about how it monitors planning permissions so that we get as close as possible to meeting the needs of local people set out in the SHMA, as opposed to simply building houses that will maximise developer profits.
Thanks to Hart Council for putting in the effort to dig the raw data out of their systems, which I know has been a difficult task.
