5,000 extra houses in a new town in Hart District will dramatically increase congestion all over the district, including Fleet and Church Crookham with 10’s of thousands of extra journeys per day. It is clear that those councillors who think they are getting a free-ride from a new town in Winchfield need to think again and campaign for fewer houses to be built overall.
If you think the council should think again, please sign the petition: https://you.38degrees.org.uk/petitions/we-hart
Hart District Council have been asked by Winchfield Action Group (WAG), as part of their Neighbourhood Planning process to provide some figures on the current road usage on roads in and around the proposed new town at Winchfield and for an assessment of the impact on neighbouring areas. Astonishingly, it seems Hart doesn’t have any traffic monitoring data.
Helpfully, the appendices in the Strategic Housing Market Assessment (SHMA) give an analysis of the travel to work patterns of Hart residents and the Department of Transport has conducted a National Travel Survey (NTS) that has helped the We Heart Hart (aka We ♥ Hart and We Love Hart) campaign to calculate the impact of all of these extra houses and extra cars.
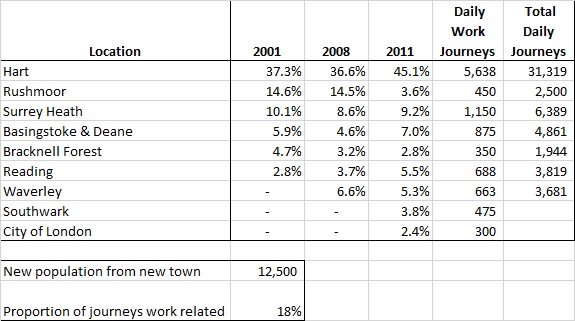
The SHMA says that we can expect around 2.5 people per household, the SHMA appendix gives a split of how Hart residents travel to work and the NTS says that work related travel accounts for only 18% of journeys. Of course people need to go shopping, play sports, visit friends and relatives, go to clubs and societies and ferry around their children and so on.
Using the 2011 numbers it is possible come up with the extra journeys 5,000 extra houses will generate. Of course, these numbers will need to be doubled if they go ahead with the new town and Hart has to act as a sink for the 3,100 extra houses that Surrey Heath and Rushmoor say they cannot build. This is shown below.
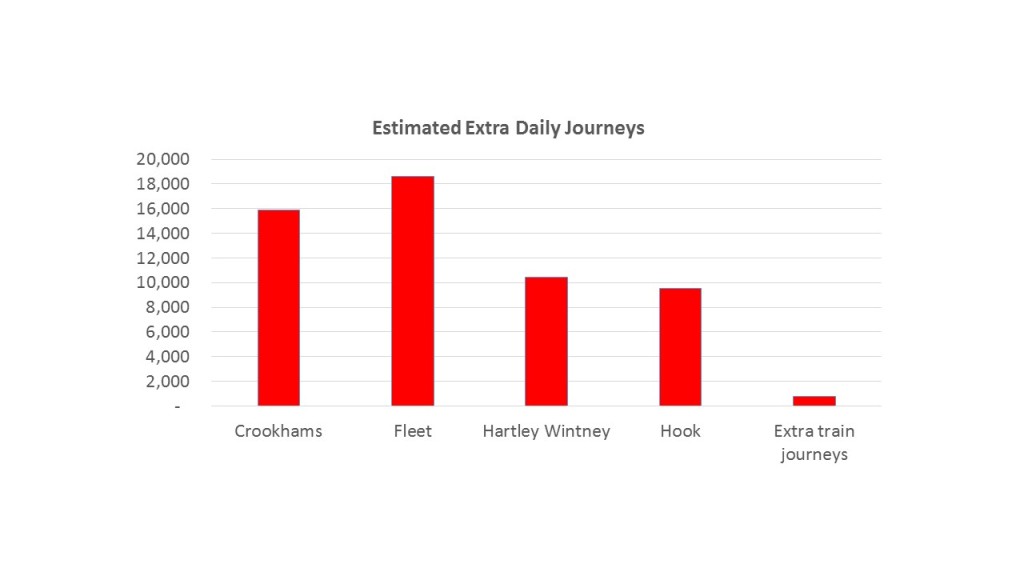
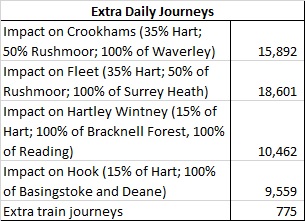
Using this data, you can come up with an estimate of the impact of all these extra journeys will have in terms of increased traffic in Fleet, Church Crookham, Hartley Wintney and Hook because of the routes people will have to follow to get to those destinations. Of course, there will be also extra train journeys, giving rise to 775 extra commuters going to London each day without even estimating the other non-work related journeys:
This is of course a very rough and ready estimate, and Hart will no doubt have to find a way of doing some better modelling. But this gives an indication of the impact which is far from trivial.
Surely it is very important that the impact of building 5,000 houses in a new town, or more than 10,000 if Surrey Heath and Rushmoor get their way, is properly assessed by the council before they finalise the local plan. Not only that there are going to be thousands of new houses in neighbouring areas like Basingstoke and Deane, Reading and Waverley. All of these houses are bound to increase the traffic even further in Hart too.
Of course everyone has sympathy for the level of development Fleet, Church Crookham, Crookham Village and Hook have had to endure over the past few years. But it is clear that building a new town in Winchfield will only add to the problem of congestion for those areas and the councillors who think they are getting a free-ride from a new town need to think again and start campaigning for fewer houses to be built in Hart.
Download a poster: https://wehearthart.co.uk/home/get-involved/
Sign the petition: https://you.38degrees.org.uk/petitions/we-hart
Like us on Facebook: https://www.facebook.com/groups/IHeartHart/
Follow us on Twitter: https://twitter.com/WeHeartHart


Pingback: We Heart Hart Petition to campaign against concreting over the green fields of Hart District breaks 2,000 barrier
Pingback: We Heart Hart petition breaks the 1,500 barrier | We Heart Hart
Pingback: We Heart Hart Questions for Hart Council | We Heart Hart
Pingback: We Heart Hart petition is now twice as big as Hart District Council consultation | We Heart Hart
Pingback: Official: Hart has no Vision | We Heart Hart
Confused about the tables:
They make no sense. The “Extra Journeys Arising from New Town in Hart” has three columns but had no explanation about where they came from. Should they total 100% ? They didn’t do that in either the columns or rows. The figures in the right hand column just magically appear. What do they mean?.
The “Impact on Fleet, Church Crookham, Hartley Wintney and Hook” table is as bad. What are the percentages? Where do they come from? The figure in the left hand column means nothing.
Sorry I should have been clearer. The places Hart people work comes from a table in the SHMA appendix. The columns with years above show how the data has changed from 2001 to 2011. I used the 2011 numbers as a base and then worked out how many extra journeys would arise from people going to work and then scaled that up because work journeys are only 18% of our total journeys.
This really needs some proper modelling that I don’t really have the time to do. It also needs some better data to model, but as far as I know Hart aren’t doing any traffic studies. So we can only do some educated guess work.