In an email to councillors, the joint-CEO of Hart Council has made a desperate attempt to justify the Council’s inflated housing requirement in the Local Plan. This justification breaks Government guidance on when to build more than indicated by the standard method.
This comes after the release of ONS figures showing reduced household growth in Hart. By our calculations, we already have sufficient housing supply to 20141 and beyond without an unnecessary 5,000 house new town at Winchfield/Murrell Green.
In summary, he uses bluster, imaginary new ONS releases, unstarted Government consultations and dodgy logic to try to justify why the housing requirement will go up, when in fact the ONS figures show it is going down.
We are in the ridiculous position of the council arguing that we should keep an inflated housing requirement and build far more than we need to.
Inflated housing requirement breaches Government guidance
This is against Government guidance on when to plan for more housing than the standard method.
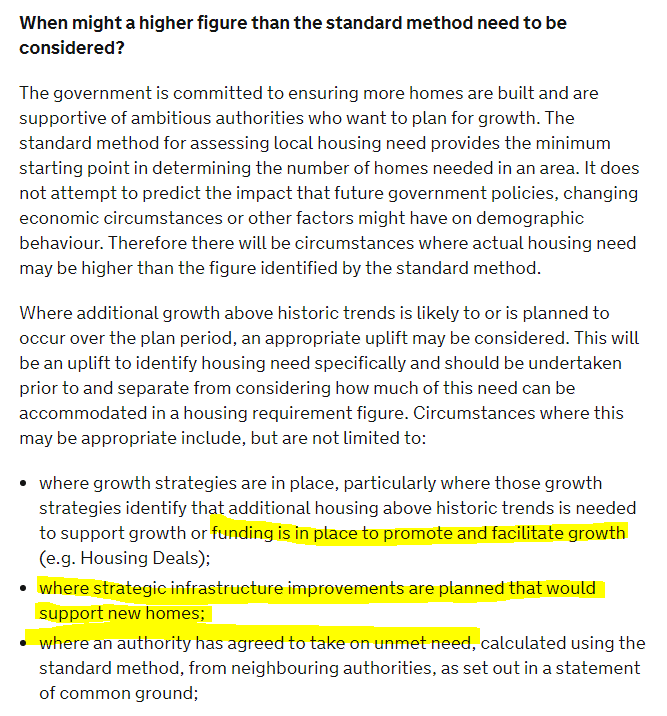
When to build more than the standard method
- There is no funding in place to promote growth. No part of Hart is identified by the M3 LEP as a growth area that will attract investment
- There are no strategic infrastructure improvements planned. In fact Hart has a massive infrastructure funding deficit. Extra houses will make this worse.
- Rushmoor is already planning for far more houses than it needs. The new ONS projections mean Surrey Heath can meet its own needs in full.
So, Hart meets none of the criteria to justify building more than the standard method says.
However, the council is breaking with this guidance and planning to build even more houses in the new town. They are proposing to spend £1.5m of public money to press on with it anyway.
Below we reproduce the email in full, together with our comments in red.
Hart CEO email to councillors
Dear Councillors, last night we received questions about the implications for the local plan and the assessment of Hart’s housing needs following the sharp fall in household projections as reflected in recently published Office of National Statistic (ONS) projections on 20th September 2018. The household projection data is a key input into the new standard method of assessing housing need, and the new figures have prompted dramatic drops in many councils’ housing need figures when factored into the standard method.
Graham Cockarill pointed out that this was of concern to the Government and that the Government had delayed the use of the new methodology for calculating housing need because the revised projections undermined the Government’s objective to boost significantly the supply of new homes through building 300,000 new homes per annum.
The Government has issued guidance on how to calculate housing need in this period. This says that although the new standard method is not mandatory, any deviation will be closely scrutinised
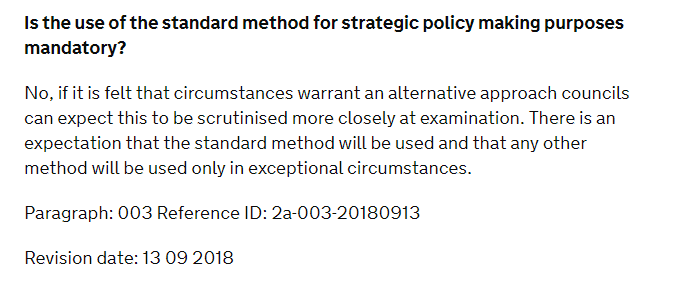
Planning guidance use of standard method to calculate housing need
But it has emerged today that the ONS plans to publish a different version of its figures on 3 December.
Yes, but this new version apparently just puts more detail on the figures released on 20 September 2018, by breaking out the household projections by housing type. There is no suggestion that the overall figures will change.
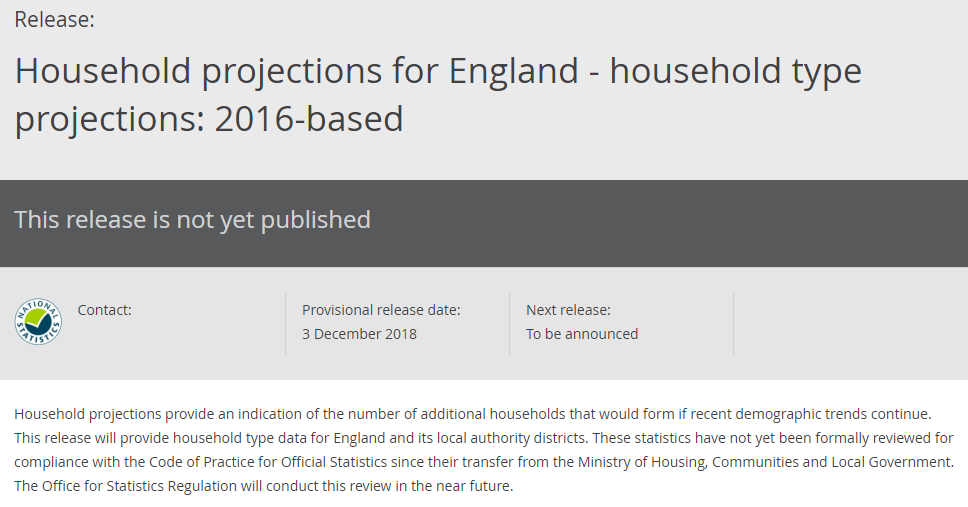
ONS Household type projections December 2018
The ONS is also planning to publish a set of variant based household projections in which household formation rates for younger adults (those aged 25 to 44 years) are higher.
They may well be, but we can find no evidence of this in the ONS’ schedule of upcoming releases up to 31 December 2019. If this is going to arrive, then it is beyond the timing of the Local Plan examination and thus cannot be considered.
The ONS’s willingness to publish “variant” projections reflects its acknowledgement of concerns about the new approach taken to drawing up the 2016-based figures. Unlike the 2014-based projections, which drew on data from as far back as the 1971 census, the 2016-based figures were compiled with statistics that only go back to 2001. Critics have said that the new projections thus ‘bake in’ the adverse consequences for household formation of housing under-delivery in this century.
“Experts” have been predicting that the average household size would continue to fall in line with the experience of earlier decades. However, the 2011 census showed that this trend had come to an end. Actual behaviour stubbornly refused to comply with expert opinion. The ONS’ own analysis of its new numbers still shows a reduction in average household size out to 2039. However, the rate of reduction in the newer 2016-based figures is slower than the 2014-based projections. We believe that part of this is down to social change – people are getting married later than in the 1960’s and 1970’s. THe increase in house prices may have played a part, but we already know from Ian Mulheirn’s analysis that building more won’t reduce prices. Prices are mostly driven by ultra-low interest rates.
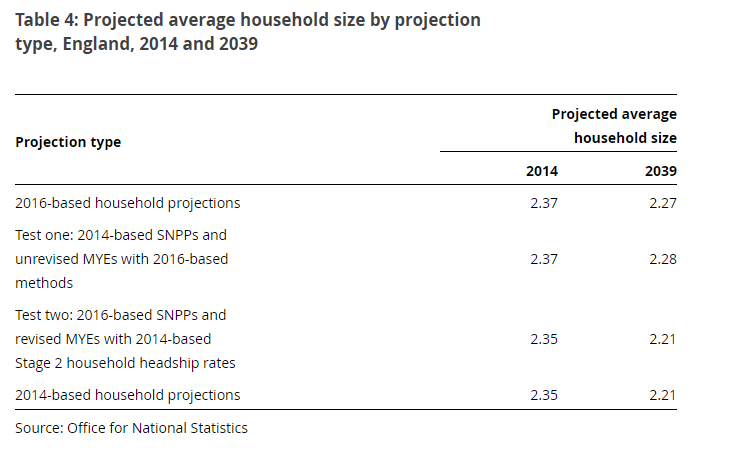
ONS impact of 2016-based projections on household size
In its methodology document, the ONS acknowledges those complaints. It says some respondents to its consultation on the new method thought that using data from only the 2001 and 2011 censuses would be “insufficient”. It says that: “There was a view that only using the 2001 and 2011 censuses would result in a downward trend in household formation for the younger age groups, which in turn would downplay the need for housing for younger people”.
OK. So what. It seems the ONS disagrees with this view, or it wouldn’t have continued with the method it has adopted.
The government has already said that it will consult on adjustments to the way housing need is calculated so it is consistent with delivering 300,000 new homes per year by the mid-2020s and that it will do this “as soon as possible”.
The Government may well have said that, but the consultation has not been launched. In effect, the Government has set a ‘top-down’ target of 300,000 houses per annum. Now the detailed bottom-up work has shown this to be far more than we need, it is trying to find a way of fudging the numbers to arrive back at the number it first thought of. It is inconceivable that such a consultation can be launched, completed and the results analysed before the Hart Local Plan is examined. This might be a risk to the housing target we eventually adopt. However, surely the way to mitigate this risk is to demonstrate flexibility of supply, rather than increase the target. We have already shown that Hart has sufficient supply out to 2041 and beyond, without the unnecessary new town.
In effect therefore, the Government is not running with the current 2016 household projections for use with the standard methodology and as Cllr Cockarill highlighted, the Government’s objective is to boost the supply of new homes and wants to put in a methodology that does exactly that.
This is, at best, a disingenuous statement. The current Government guidance says the national household projections should be used. It isn’t clear which version should be used, but surely it makes most sense to use the most up to date figures.
Planning guidance setting the baseline using national household growth projections
The worked examples in the Government guidance are a bit ambiguous. We believe that using the new Government standard method is either:
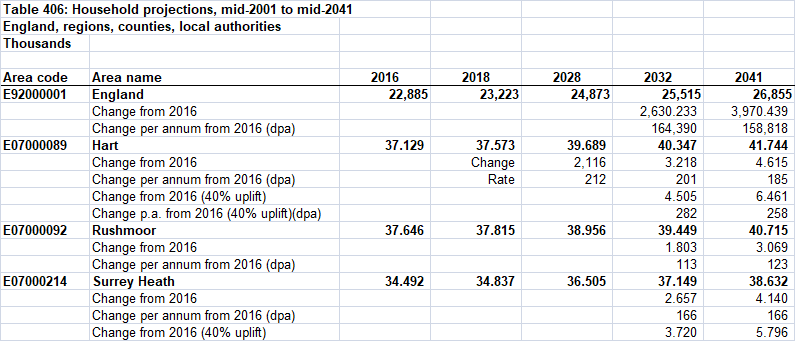
Hart Household change 2018-2028
a) 212 * (1+0.4) = 297 dwellings per annum using the capped 40% affordability uplift, or worst case
b) 212 *(1+0.5) = 318 dwellings per annum
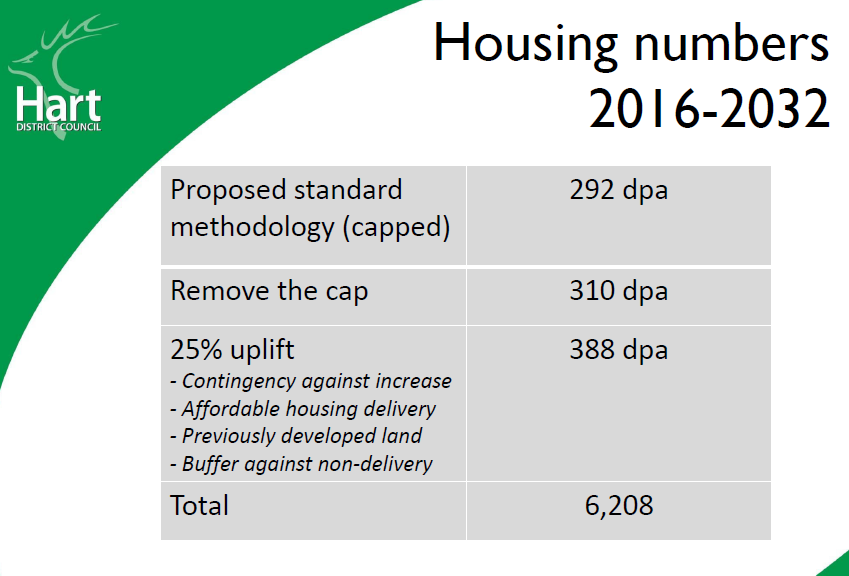
This compares to the 388dpa used in the Local Plan.
I think we can safely read into this that it means that the overall number of homes to be built is likely to go up rather than down.
There is no justification for this statement. There is already at least 70dpa headroom (or over 1,120 houses in the plan period) between the Government standard method and the Hart Local Plan. And even this elevated housing target does not require the proposed new town to be built. In any event, the best mitigtion for this is to demonstrate flexibility in supply
That was exactly why we included a buffer in our housing needs and until we see what they new “variant” projections look like it is not wise to make any assumptions about not having to meet our neighbour potential unmet housing need.
The new household projections mean that Surrey Heath can meet its own need. Rushmoor is already planning for far more houses than it needs to build.
We now have the ridiculous situation of the council arguing to keep an inflated housing requirement and build more houses than we need so it can somehow justify keeping the unnecessary new town in the Local Plan.