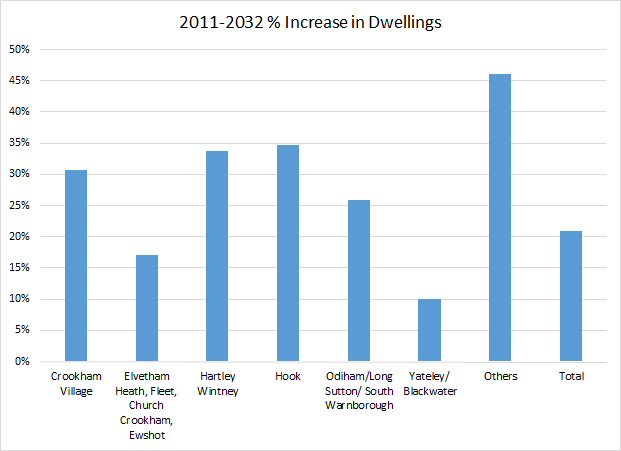
Proposed percentage increase in dwellings by parish in Hart District.
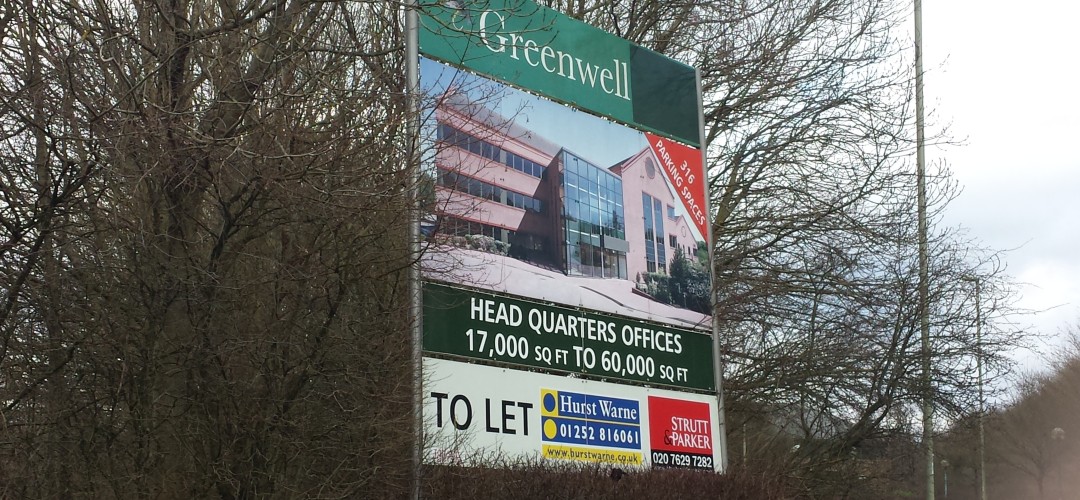
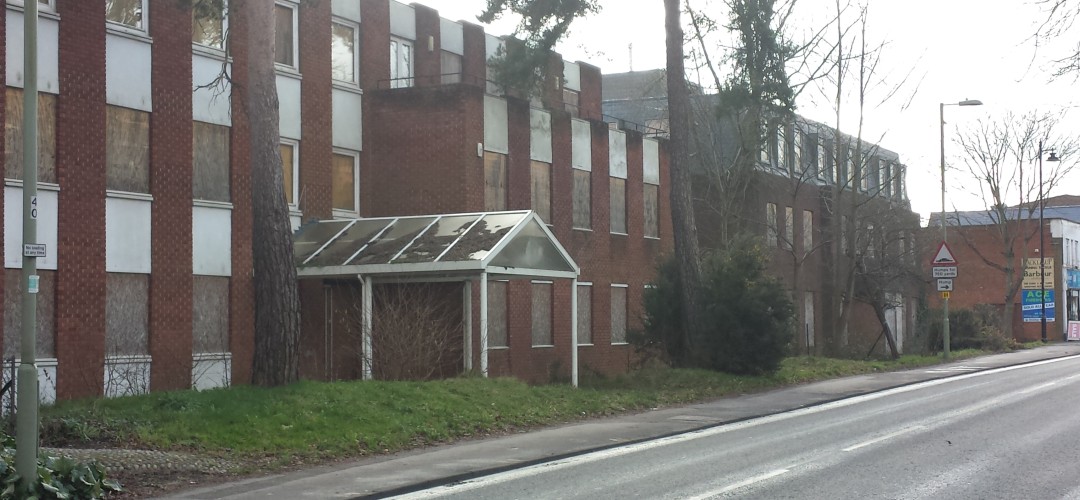
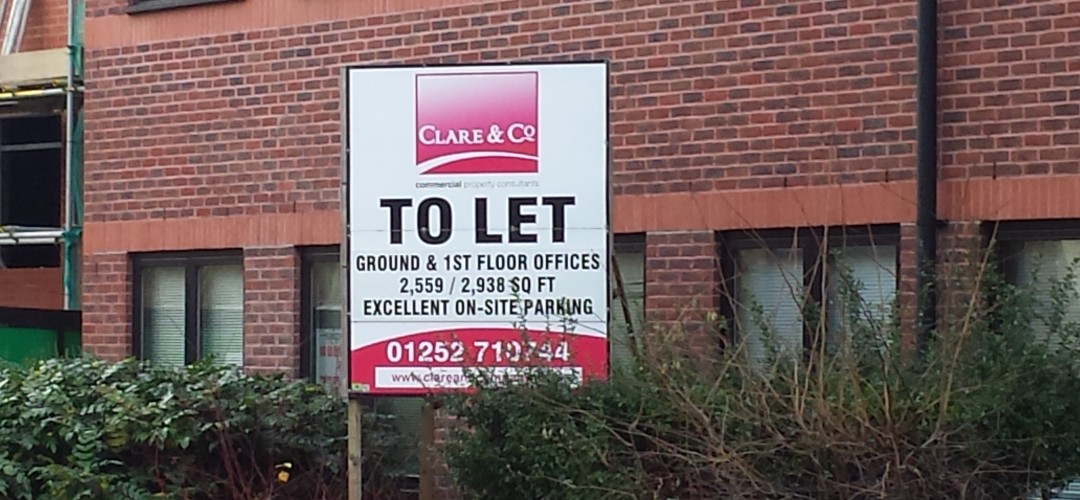
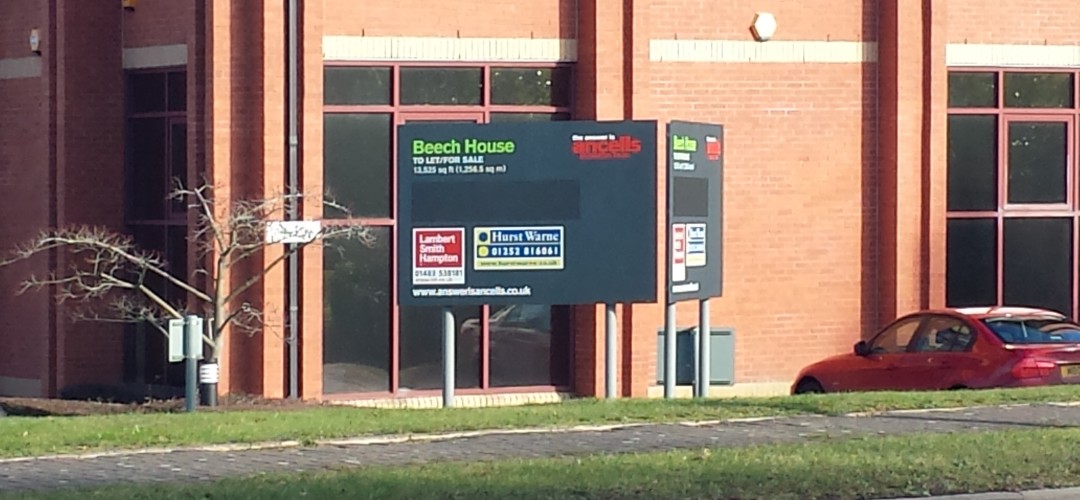
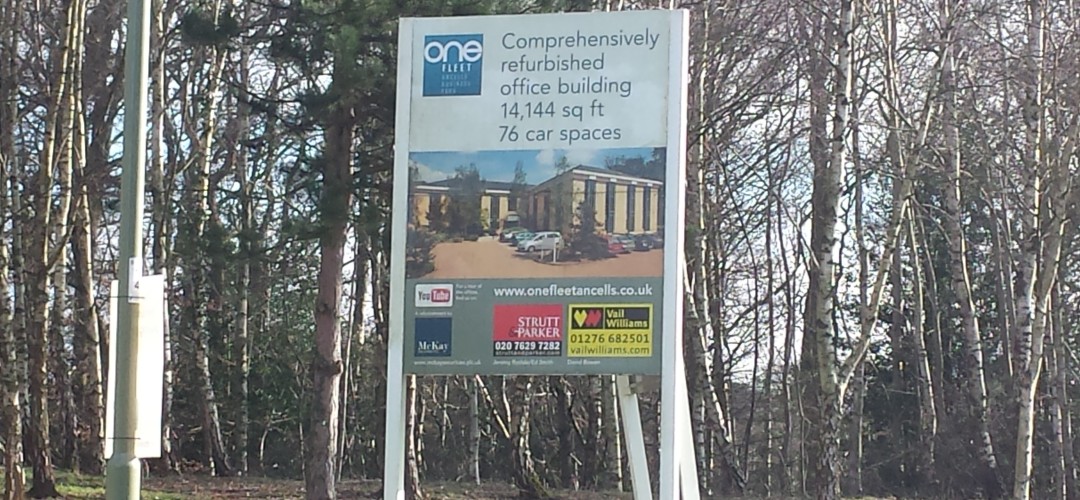
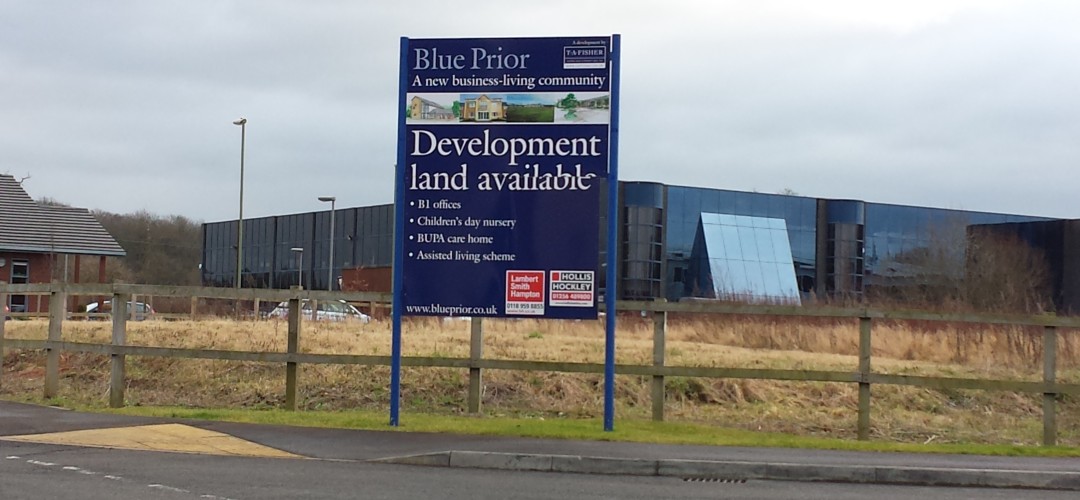
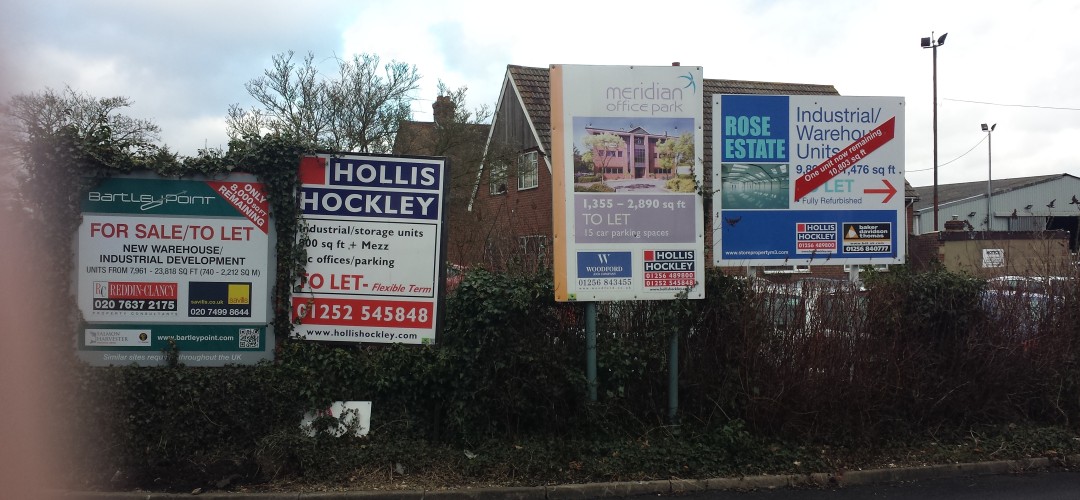
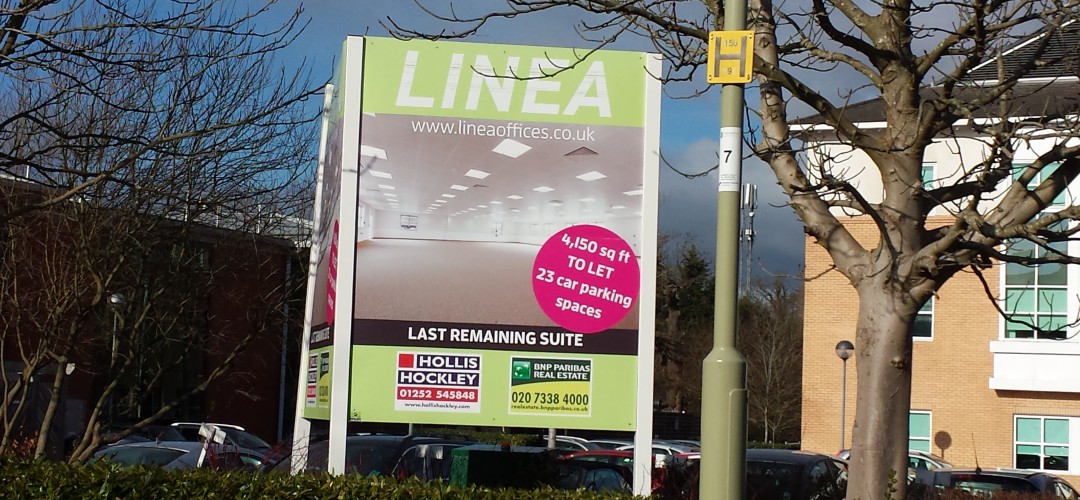
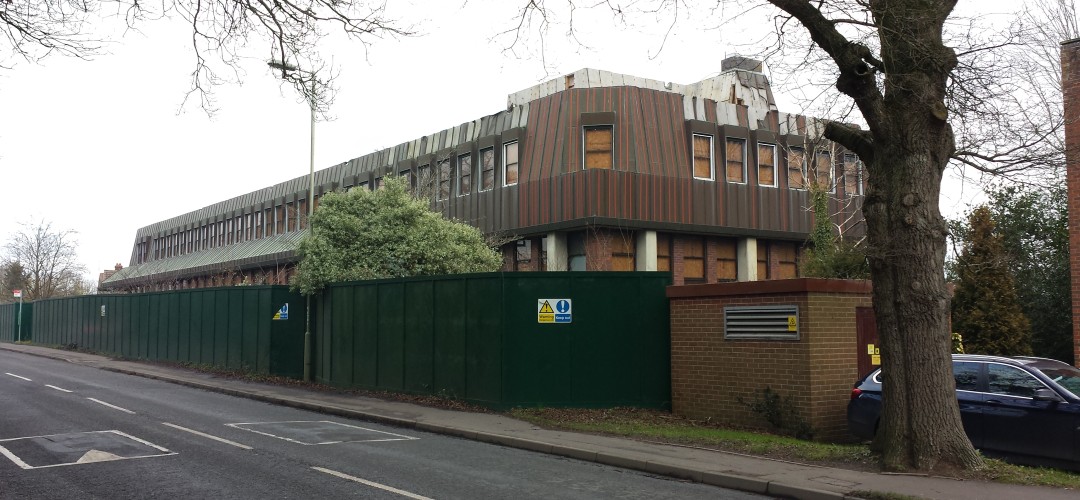
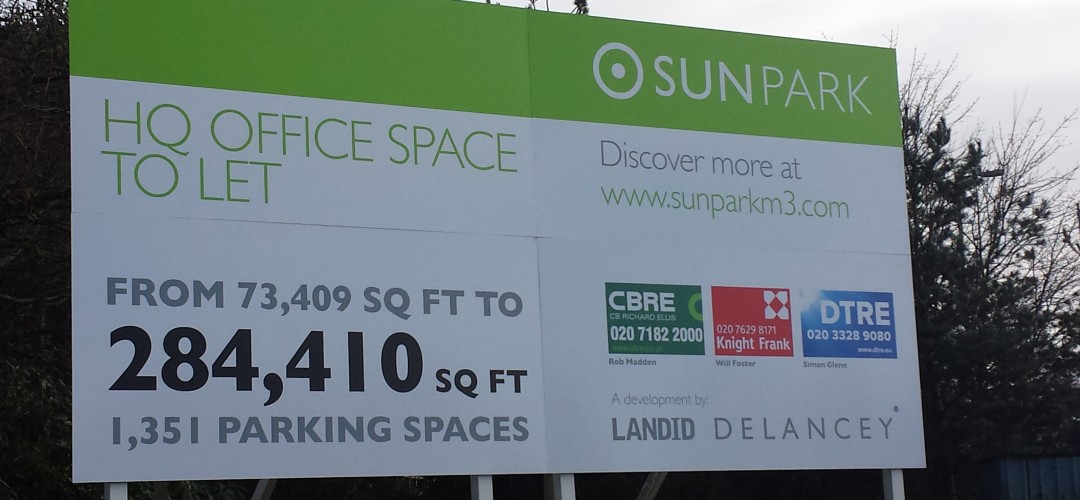
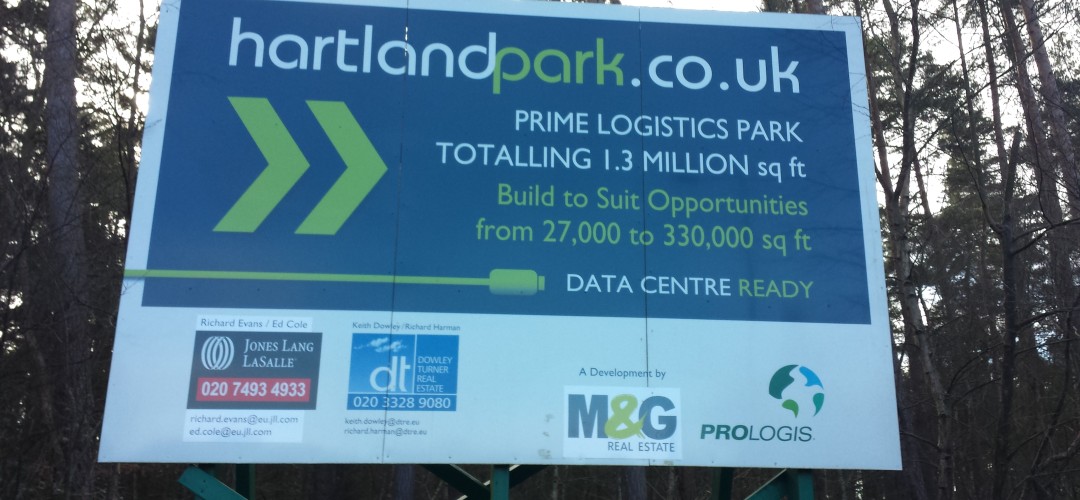
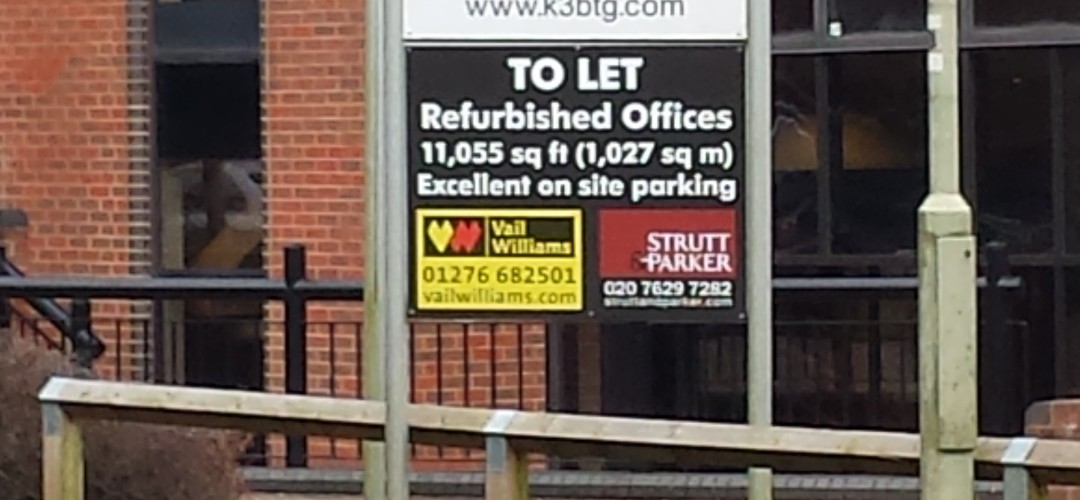
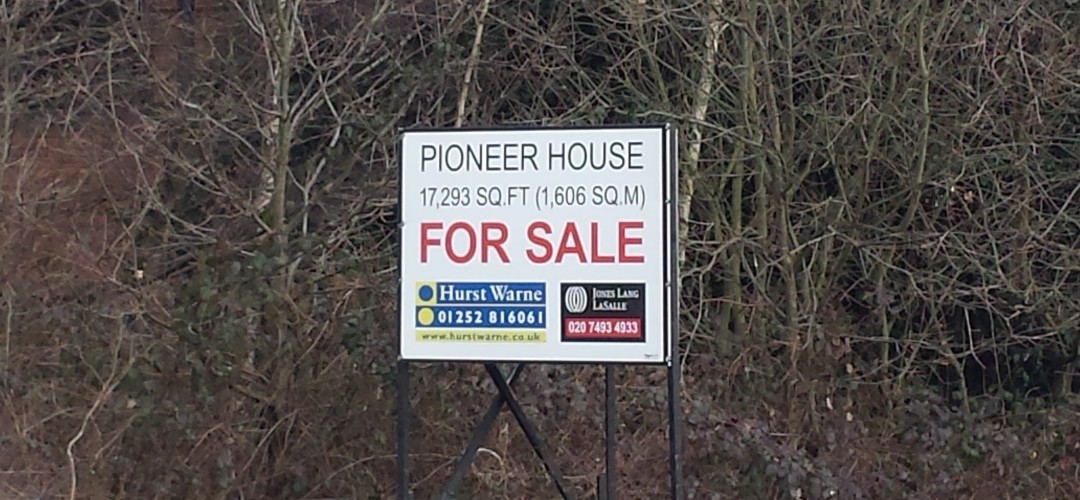
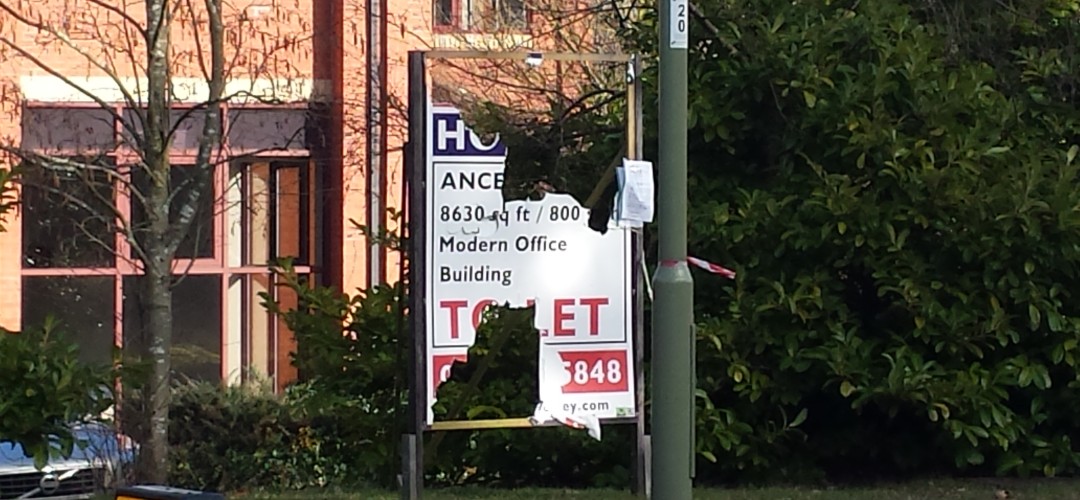
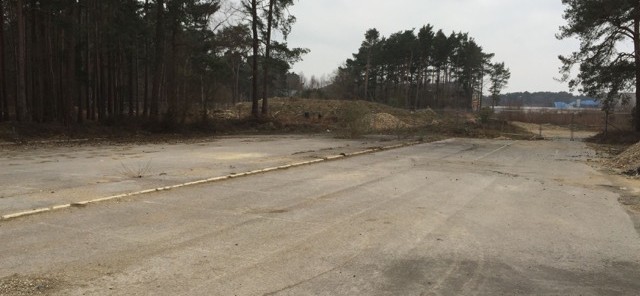
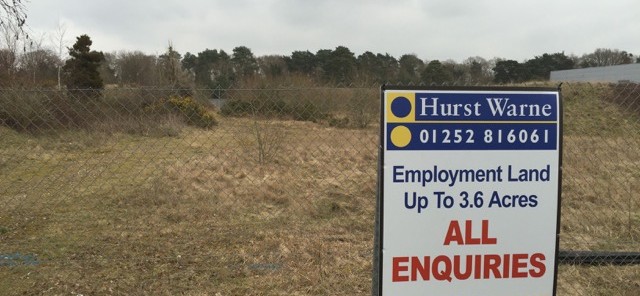
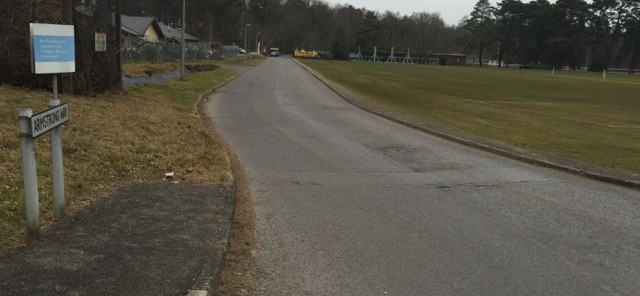
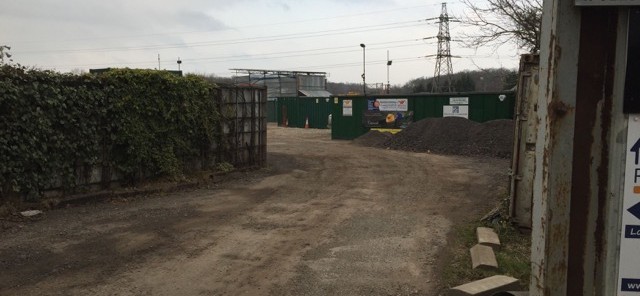
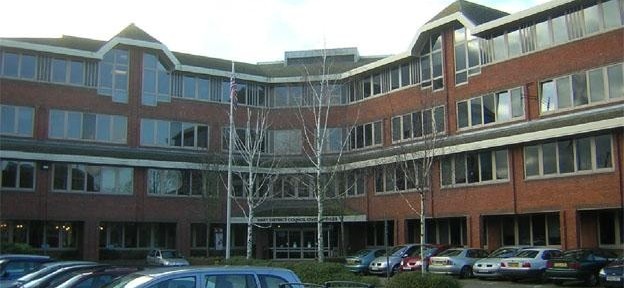
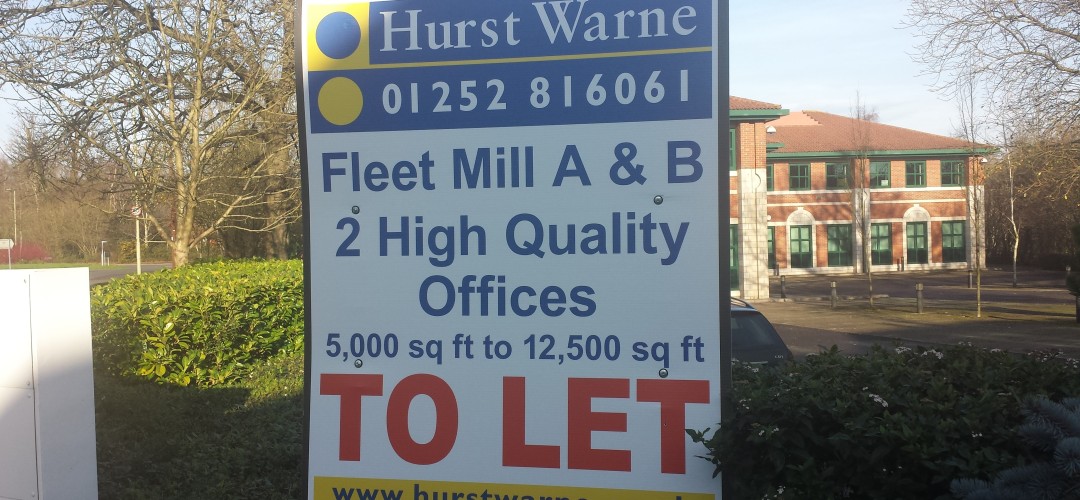
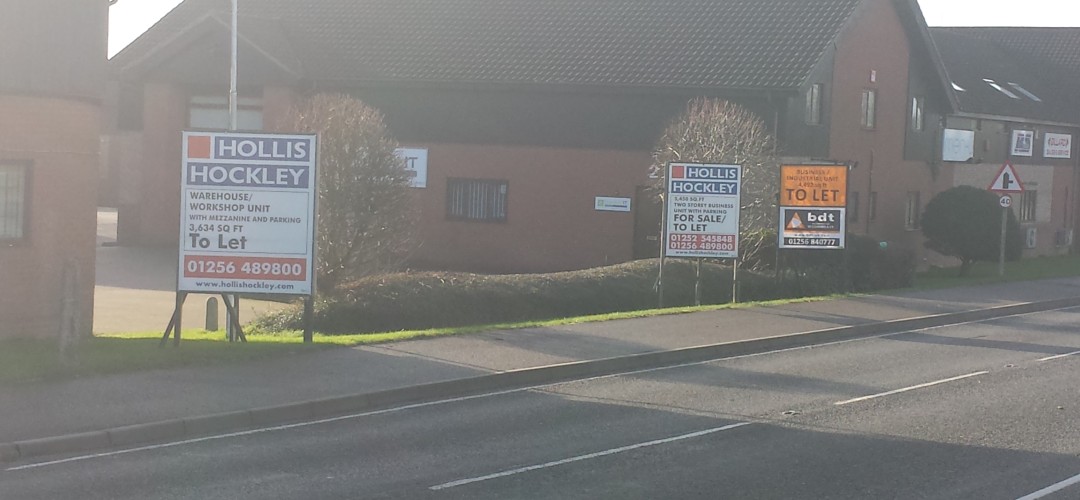
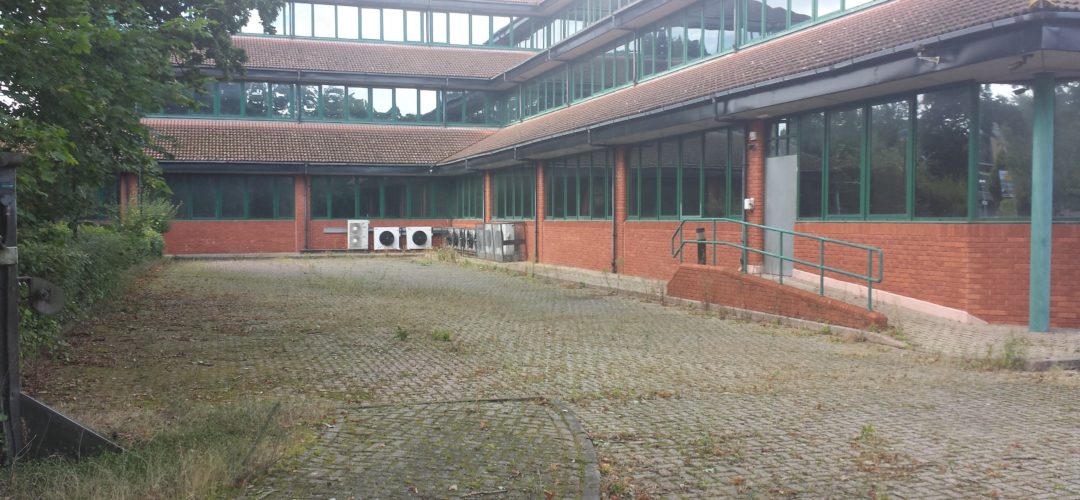
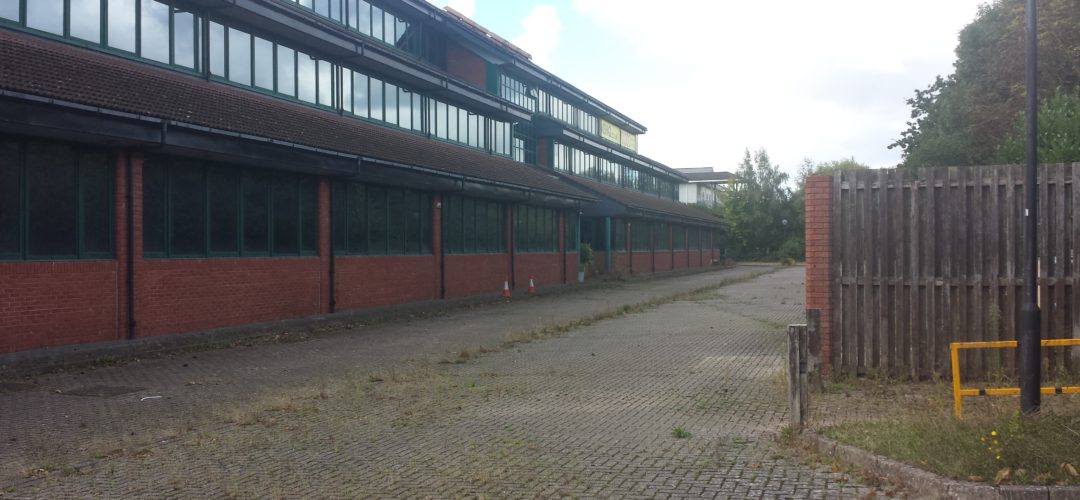
Hart Council has published a lot of data related to the new consultation. We have taken a look at it, come to the conclusion that the combination of the houses built or permitted since 2011, plus the proposals for dispersal show that our urban areas are not taking their fair share of housing. We think that Hart District should be trying harder to find brownfield sites in Fleet, Yateley and Blackwater to redress the balance and save our countryside (see slider of sites below).
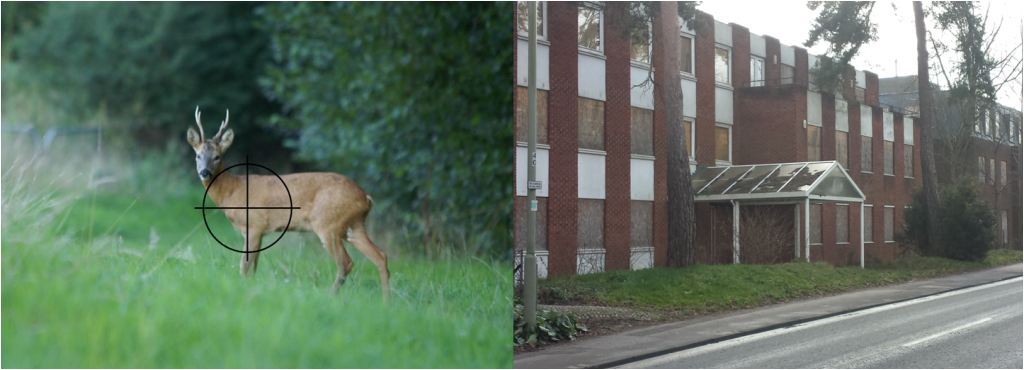
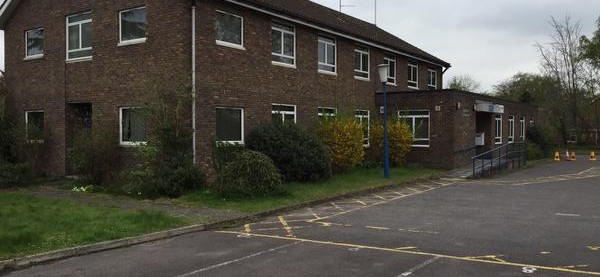
Which would you rather preserve – derelict eyesore or our wildlife?
The chart above shows the %-age increase in dwellings by parish by combining the data shown in the table in para 30 of the main consultation document. This gives the distribution of dwellings built or permitted since 2011:
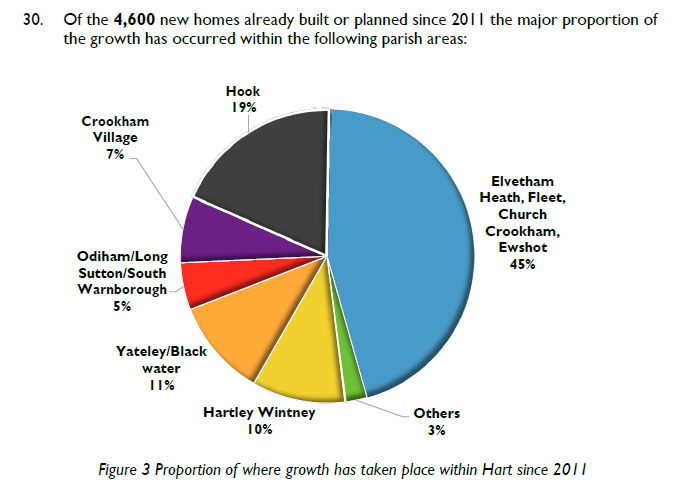
Split of dwellings built or permitted since 2011 by Parish
It did look odd to us that the parishes of Elvetham Heath, Fleet, Church Crookham and Ewshot should be grouped together like they were to give the impression that these parishes had already taken a lot of housing. Of course if you combine a number of parishes together, then it is obvious that their combined contribution is going to be larger than the individual parishes to which they are compared.
So, we started with the census data for the number of dwellings by parish, and combined them together in the same way Hart had, then added on the number of houses implied by the figure above, then added the number of houses proposed by the dispersal option and expressed the result as a %-age increase on the number of dwellings that were there in 2011:
| Parish | 2011 Census Dwellings | 2011-2015 % of total | 2011-2015 Number | 2011-2015 % increase | Dispersal Proposal | 2011-2032 % Increase |
| Crookham Village | 1,630 | 7% | 322 | 19.8% | 177 | 31% |
| Elvetham Heath, Fleet, Church Crookham, Ewshot | 14,879 | 45% | 2,070 | 13.9% | 466 | 17% |
| Hartley Wintney | 2,222 | 10% | 460 | 20.7% | 290 | 34% |
| Hook | 3,111 | 19% | 874 | 28.1% | 204 | 35% |
| Odiham/Long Sutton/ South Warnborough | 3,142 | 5% | 230 | 7.3% | 583 | 26% |
| Yateley/ Blackwater | 9,826 | 11% | 506 | 5.1% | 480 | 10% |
| Others | 2,526 | 3% | 138 | 5.5% | 1,027 | 46% |
| Total | 37,336 | 100% | 4,600 | 12.3% | 3,227 | 21% |
This shows that the urban areas that include Fleet, Yateley and Blackwater will take the lowest %-age increase in housing. Whereas, places like Hook, Hartley Wintney and the other rural parishes are going to take massive %-age increases in housing.
Of course, a new town would disproportionately impact Winchfield, but would also lead to 1,800 further houses in Hook and effectively join those parishes to Hartley Wintney, into a giant Hartley WInchook conurbation. Even the proposed urban extensions will further increase the pressure on Hartley Wintney and Hook.
One of the proposed extensions, the so-called Pale Lane extension (SHL 52) is largely in Hartley Wintney Parish, and another of the extensions is to the west of Hook (SHL 173).
If you would like to ask Hart to abandon the new town and urban extension ideas and create a brownfield solution to our housing needs, we urge you to respond to the Hart District Council consultation about the Local Plan and ask them to think again. We have created a dedicated consultation page and updated our two guides to responding to the consultation that are available on the downloads below. The comments are designed to be cut and pasted into the boxes provided. It will be very powerful if you could edit the comments into your own words. Please do find time to respond to the consultation and play your part in saving our countryside.
Full version:

2 Minute version:


Pingback: Urban Areas not taking their fair share of homes part 2 | We Heart Hart
Ah ok. Thanks.
Ah ok. Thanks.
Richard Jackson. I do believe QEB is in there. But because CC is lumped in with Fleet, Elvetham and Ewshot, it brings the %-age growth down very significantly.
Richard Jackson. I do believe QEB is in there. But because CC is lumped in with Fleet, Elvetham and Ewshot, it brings the %-age growth down very significantly.
Are they, David Turver?
Are they, David Turver?
So are they in these figures then? Just seems low.
So are they in these figures then? Just seems low.
They were Church Crookham when they were building them.
They were Church Crookham when they were building them.
Have the 900+ houses on QEB been considered as part of church crookham? I’m suprised the % increase is so low considering QEB development?
Have the 900+ houses on QEB been considered as part of church crookham? I’m suprised the % increase is so low considering QEB development?
Hart Council manipulating the figures again; no surprise there then.
Hart Council manipulating the figures again; no surprise there then.