Hart Council launches important brownfield study

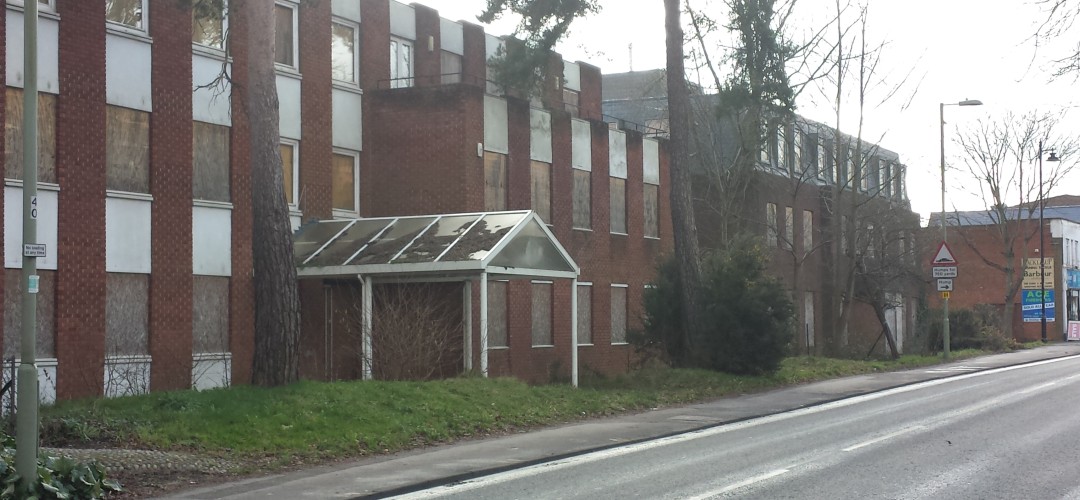
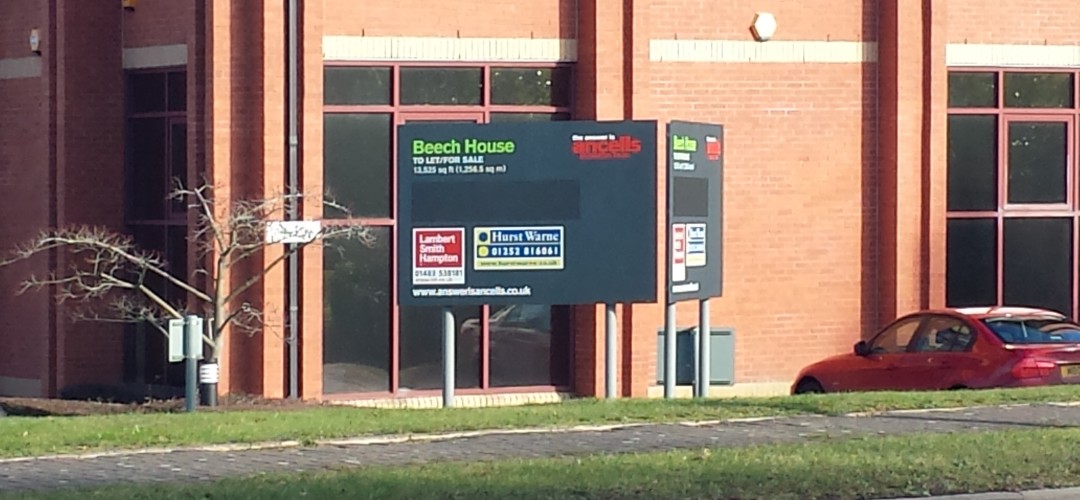
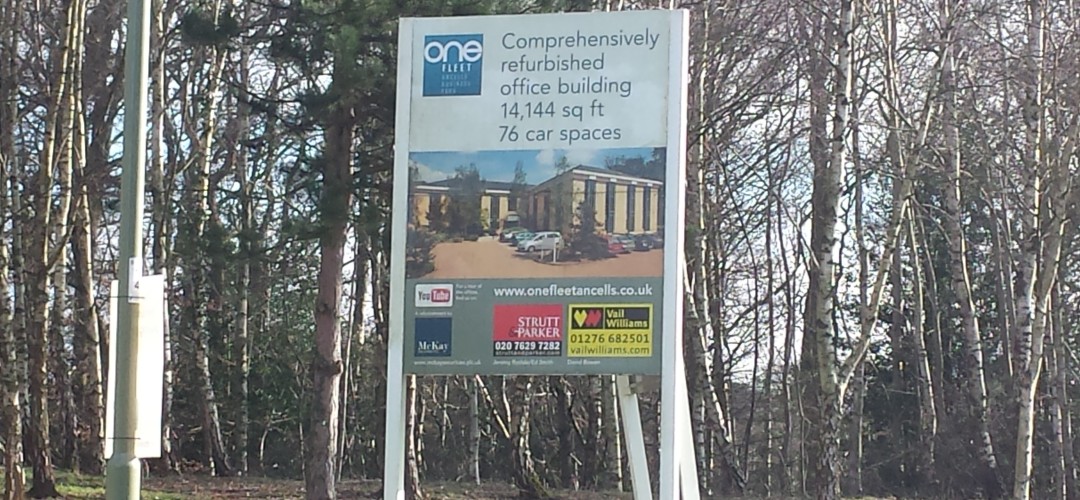
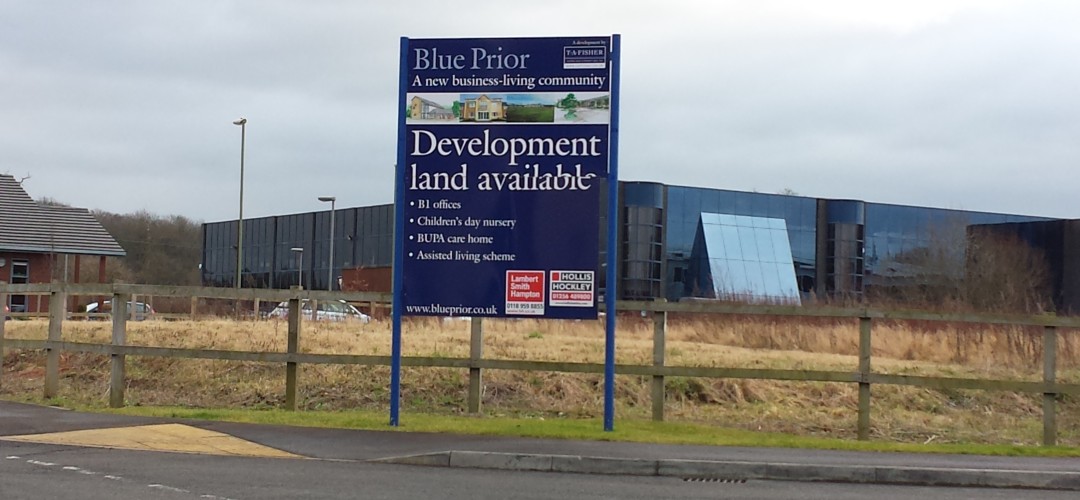
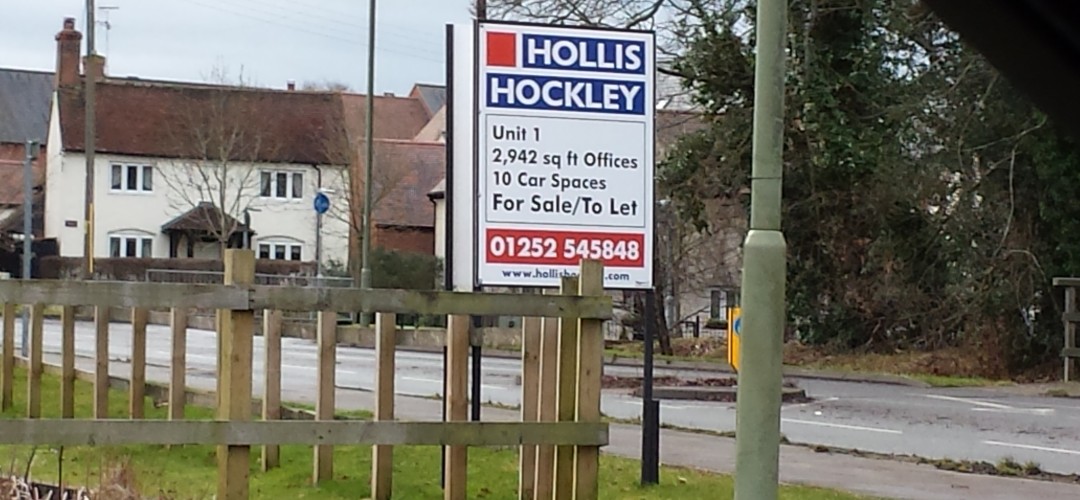
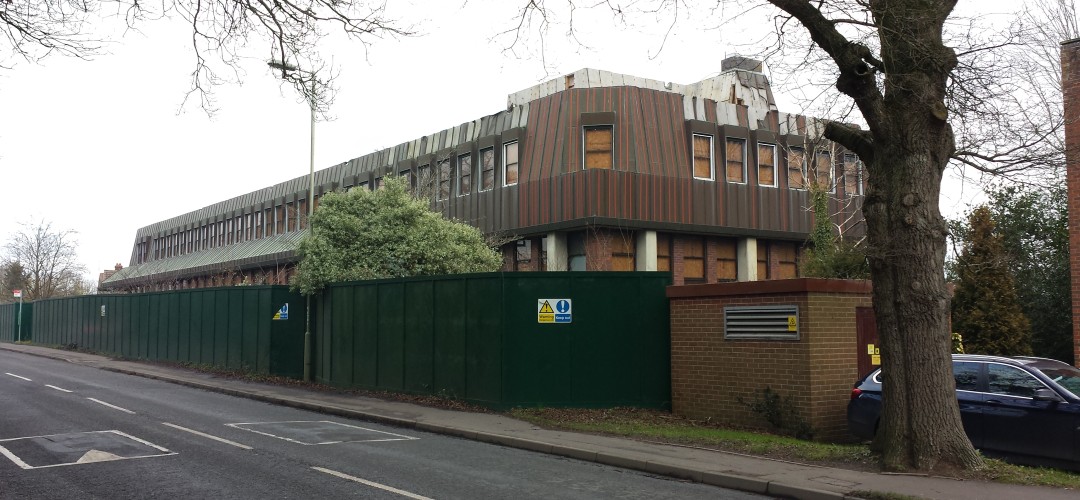
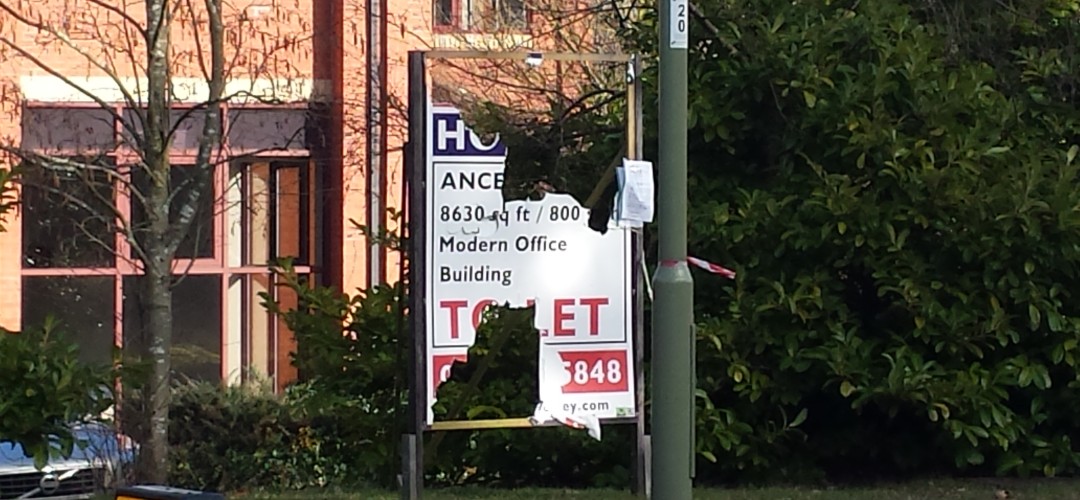
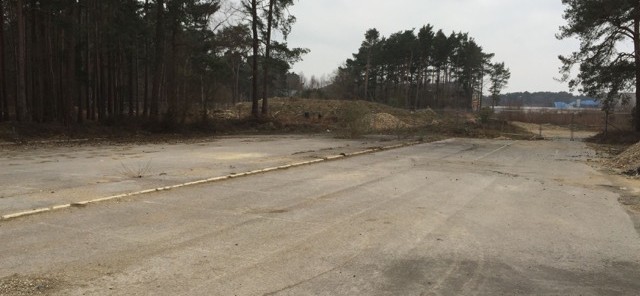
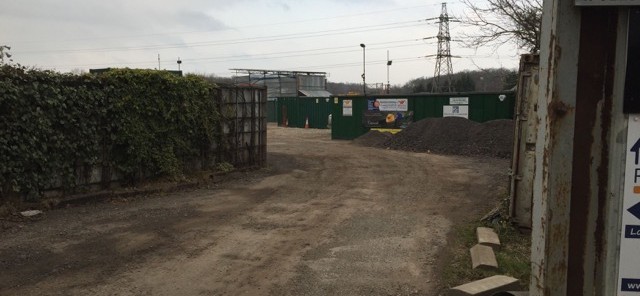
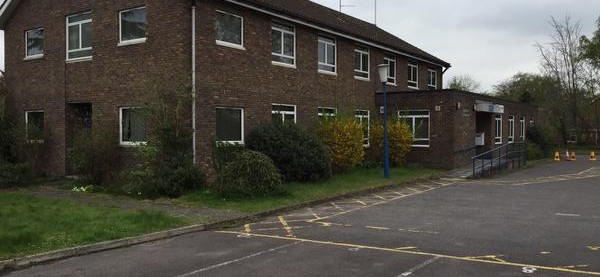
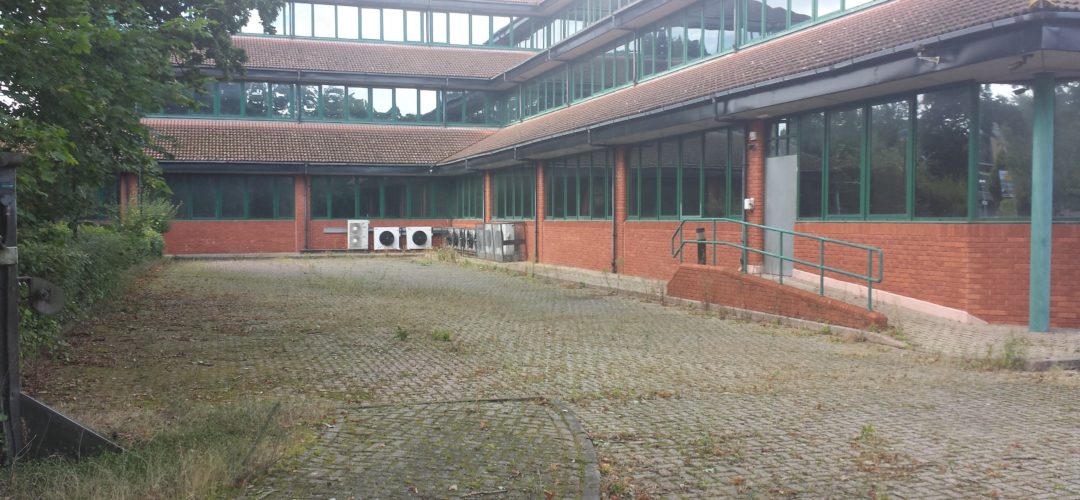
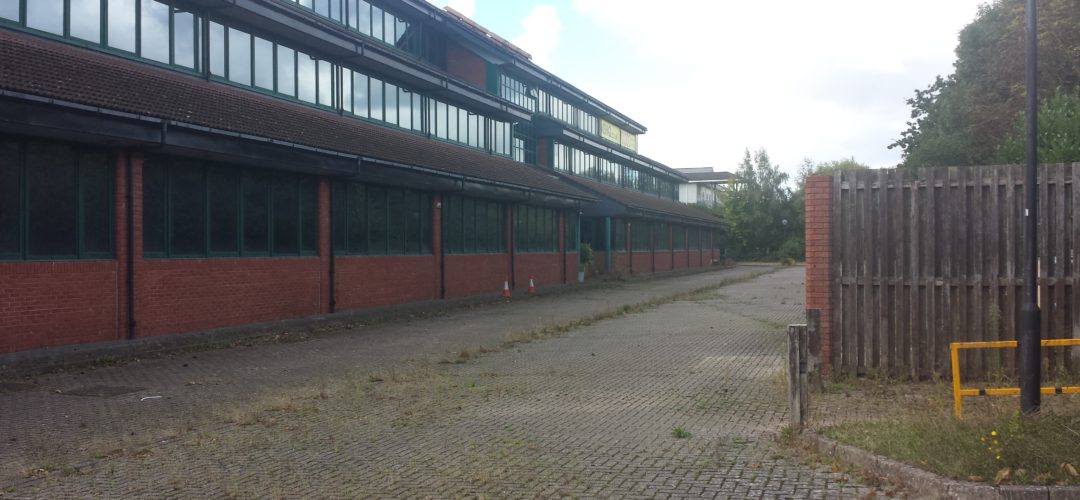
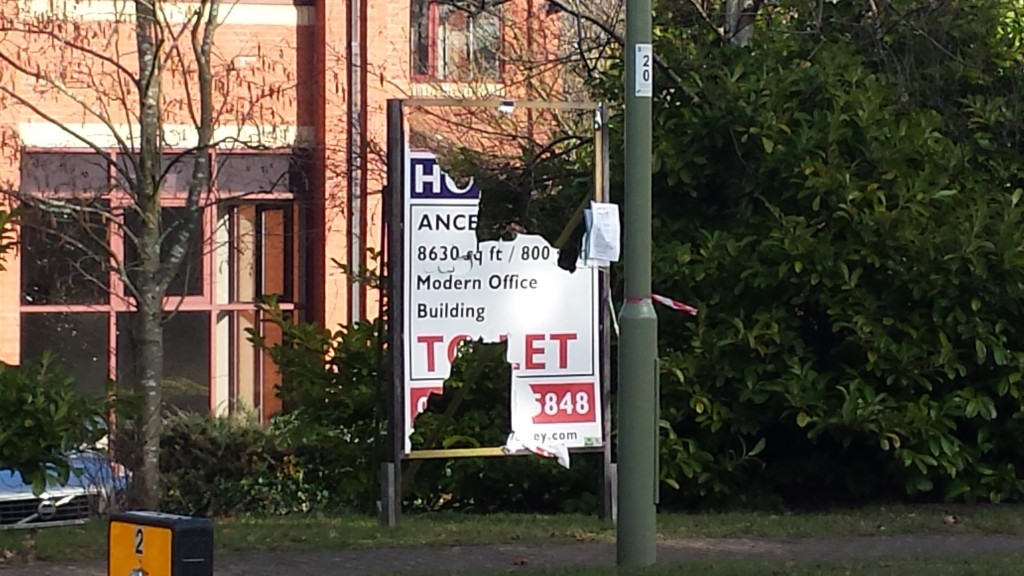
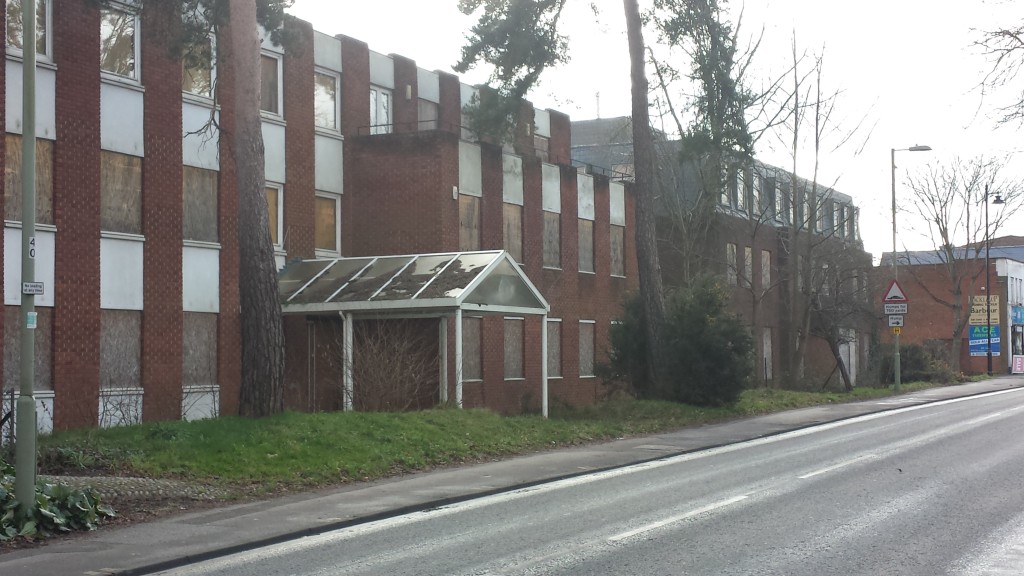
Derelict Offices in Fleet, Hampshire

We are delighted to announce that Hart Council will today launch a study to give a strategic overview of the brownfield capacity in the District that can be used to meet our housing needs.  We Heart Hart has worked with Daryl Phillips to help set the terms of reference for the study, and the project will draw on some of the work carried out by Stonegate Homes, We Heart Hart and supporters like Gareth Price.

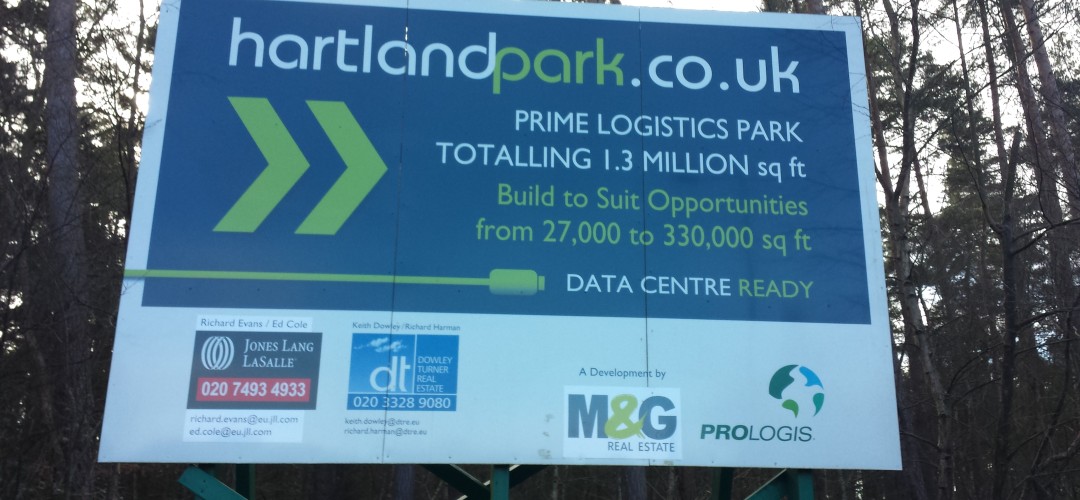
This news comes hot on the heels of yesterday’s announcement that M&G have entered into a joint venture with Berkeley Homes to redevelop Pyestock (aka Hartland Park).  Taken together with this new study, it should mean that we have sufficient capacity to meet our housing needs on brownfield sites alone for decades to come.

The purpose of the work is to ensure that the supply of deliverable brownfield land is boosted significantly by seeking a commercial market view as to what can be realistically expected to be delivered  over the Local Plan period.  This information can be used to demonstrate to the Planning Inspector that the resultant capacity is deliverable.

The work will also look to demonstrate through case study examples that higher density levels of development can be delivered in a pleasing environment compatible with surrounding development.  Hopefully, these concept schemes can be used to assuage the fears of some of the urban councillors about higher density development.

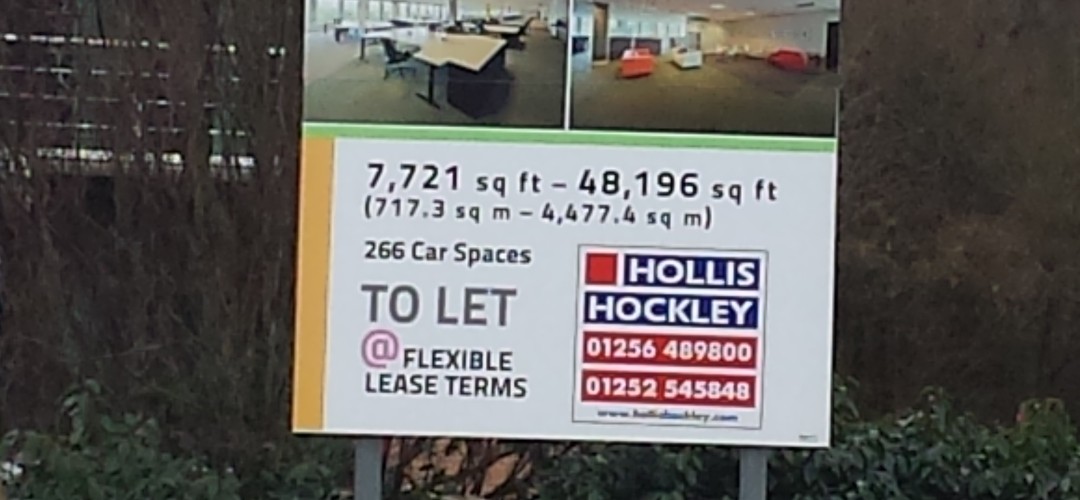
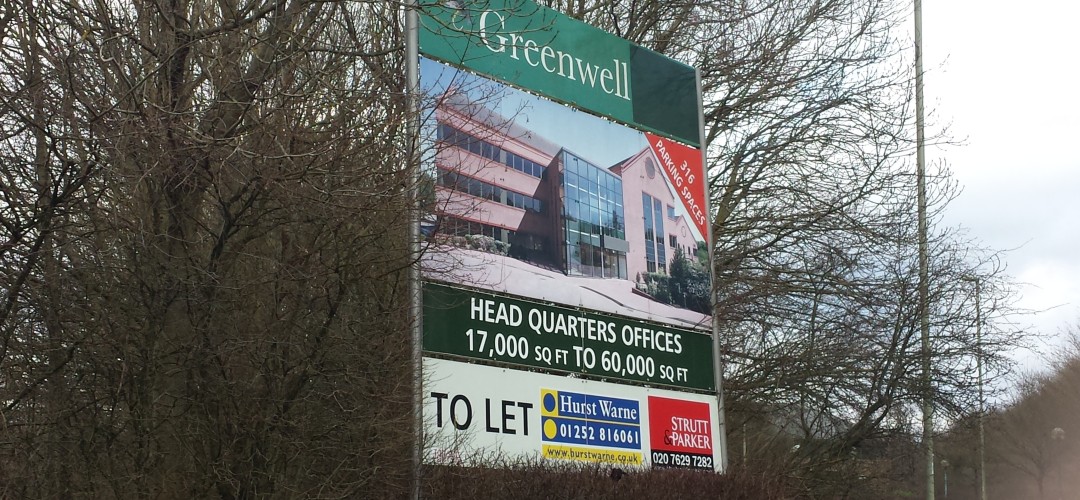
Hart has chosen to work on this project with three partners.  Eastleigh Borough Council’s urban regeneration unit will lead the work, supported by Hollis Hockley and Hurst Warne who will give commercial advice.

We warmly welcome this initiative and will work collaboratively with Hart Council and provide any assistance that we can. It shows that Hart is slowly accepting that there is much more brownfield capacity in the district than they previously thought and this project should help to unlock the barriers to delivery.  This should mean we can meet all of our remaining housing need from brownfield sites alone, so won’t need a new town, nor will we need any urban extensions.  Hopefully, all of the campaign groups across the district can get behind this project.

The detailed terms of reference of the study are:

Objectives

The primary objective is to assess the extent to which Hart is able to meet its growth requirements through the use of Previously Developed Land (PDL).

Understanding the suitability and availability of PDL to accommodate growth will in turn help determine the requirement for the release of green field land. The identification of sites for development must also be founded on a robust and credible assessment of the suitability and availability of land for particular uses or a mix of uses and the probability that it will be developed. As a result of exploring this primary objective, the following objectives will also be addressed:

  • To identify the potential obstacles to delivery of PDL and outline strategies for overcoming these obstacles and levers that planning authorities can pull to encourage sites to come forwards
  • To produce high-level illustrative concept schemes for three of the identified sites covering town centre locations and vacant office blocks to demonstrate as examples that high density developments can be attractive places to live and add to the vitality of the district

Scope

  • Assess locations across the district with particular focus on the urban centres of Fleet, Hook, Yateley and Blackwater and the employment zones including Ancells Farm, Bartley Wood and Waterside.
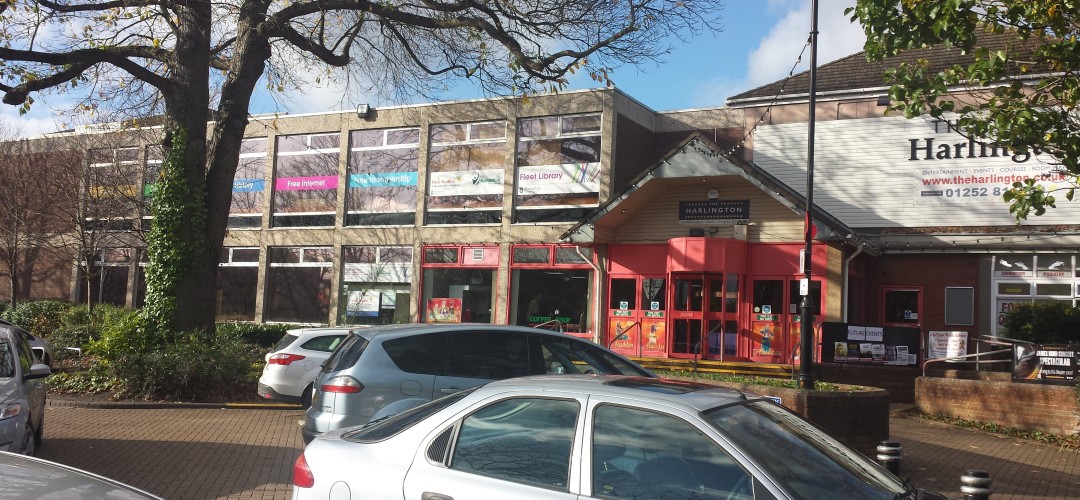
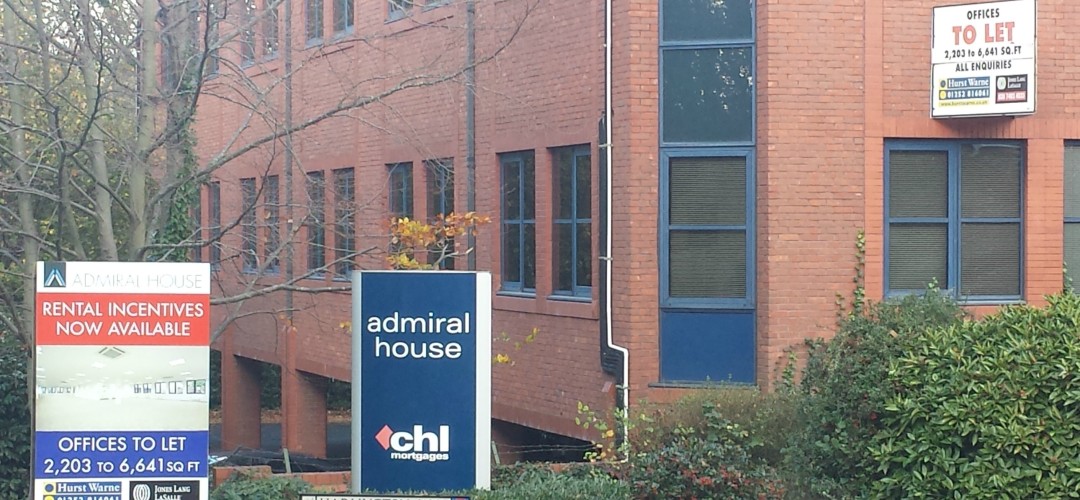
  • Prepare high-level illustrative concept schemes for three sites including Ancells Farm, Fleet Road (between tackle shop and new McCarthy and Stone development) and the civic area including Flagship House, Admiral House, Hart’s Offices, Victoria Road Car Park and the Harlington Centre and Library. [We understand that since these terms of reference were written, the civic area has been changed to look instead at how Church Road car-park and the surrounding area could be redeveloped into mixed use, including an underground car-park].

 Approach

  • Identify shortlist of partners and select appropriate architect/urban planner partner(s) to work with
  • Share existing material with partner(s), (New sites put forward as part of consultation (such as Gareth Price work), background reports from various sources including Stonegate report, existing SHLAA and sustainability assessments)
  • Desk-based study of broad locations to work up areas and capacities
  • Targeted contact with land-owners and commercial agents to identify obstacles to delivery
  • Create high-level illustrative concept schemes for three locations focusing on how high density development can be delivered in a pleasing environment whilst also meeting functional needs

Deliverables

  • Schedule of sites to include site name, location, size, capacity and type of housing and likely delivery timelines from which total PDL capacity can be derived
  • Three sample high-level schemes
  • Report of obstacles and strategies for overcoming the obstacles

Timeline

  • 8-12 weeks after partner selection


Urban areas not taking their fair share of development 2001-2032 Part 3

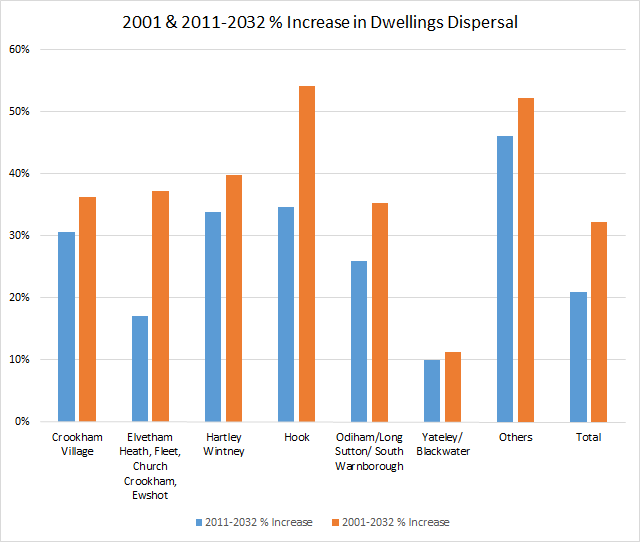
Proposed percentage increase in dwellings by parish in Hart District Dispersal 2001-2032

Proposed percentage increase in dwellings by parish in Hart District Dispersal 2001-2032

Our previous posts (here and here) about the level of development that will be faced by the different parishes under the different development proposals put forward by Hart District have been criticised for two reasons:

  1. That the parishes are grouped in to clusters and,
  2. That the analysis does not go back far enough in time

The answer to the first point is that unfortunately, Hart have only provided the development from 2011-2015 in the parish groupings shown, so there is no other way of presenting the data and still maintaining accuracy.

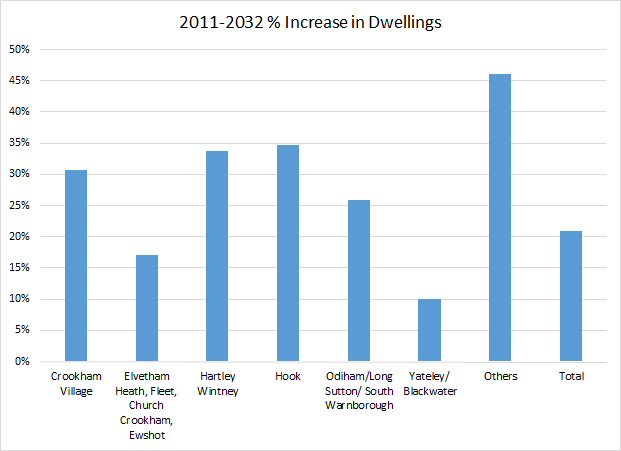
In answer to the second point, we have now incorporated the census data from 2001 into the calculations, so now it is possible to see the percentage increase in the same parish clusters from 2001-2032 and from 2011-2032.  The results in graphical and tabular form are shown above and below. This data for dispersal shows that Fleet, Church Crookham and Crookham Village will not take more proportionate development than many other areas of Hart such as Hook, Hartley Wintney and the “Other” rural districts.  But it does show that Yateley and Blackwater have taken least proportionate development over both time periods and the smaller rural districts would take a very large proportionate increase if this strategy were pursued to the fullest extent.

First, the dispersal approach, the graph is shown above, and the table below:

Proposed percentage increase in dwellings by parish in Hart District Dispersal Table 2001-2032

Proposed percentage increase in dwellings by parish in Hart District Dispersal Table 2001-2032

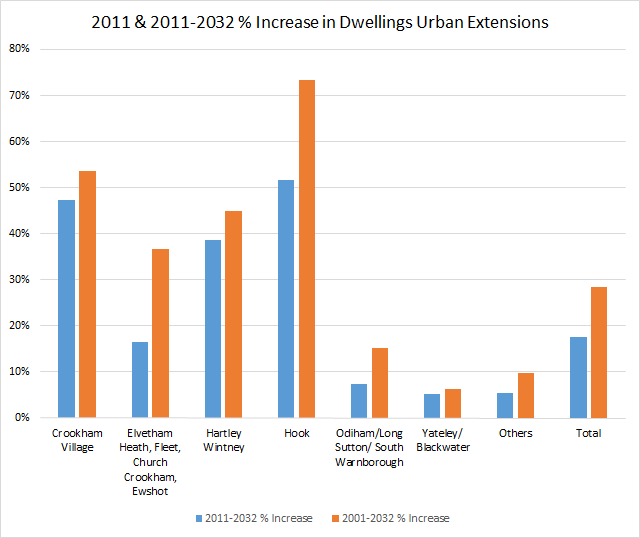
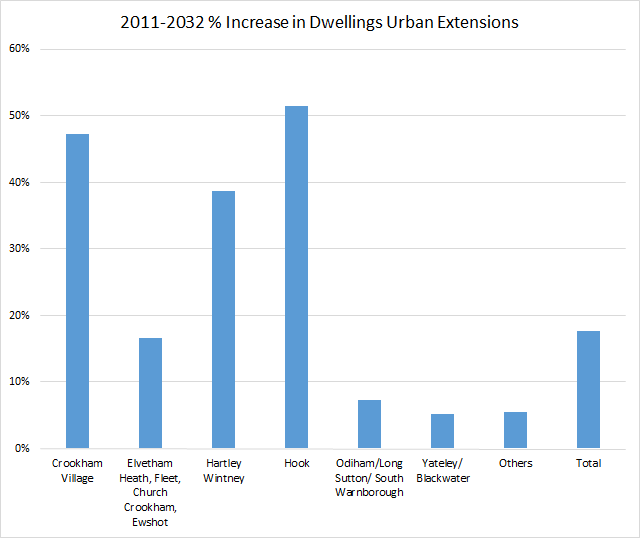
Second, the urban extension approach below. This shows that Hook will take the largest proportionate development using this approach over both time periods and Crookham Village will also see a very large proportionate increase in housing. Again Yateley and Blackwater are relatively unscathed, with the smaller rural districts taking relatively little proportionate development.  This would point towards a need for some more dispersal towards those districts, but not to the full extent described above:

Proposed percentage increase in dwellings by parish in Hart District Urban Extensions 2001-2032

Proposed percentage increase in dwellings by parish in Hart District Urban Extensions 2001-2032


Proposed percentage increase in dwellings by parish in Hart District Urban Extensions Table 2001-2032

Proposed percentage increase in dwellings by parish in Hart District Urban Extensions Table 2001-2032

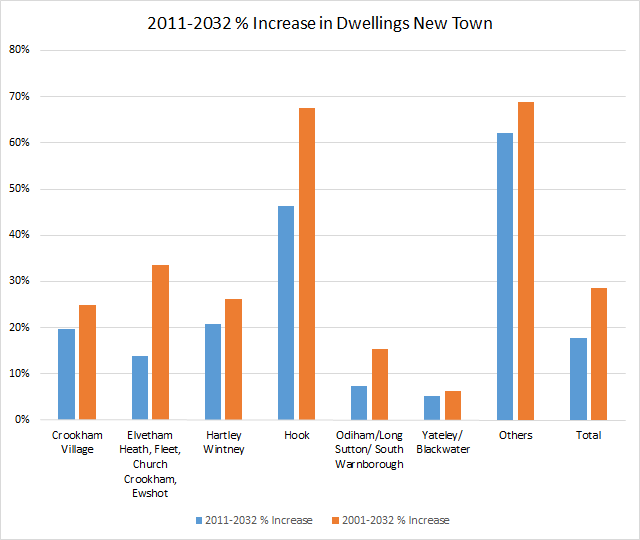
And finally, the new town approach. This shows again that Hook parish would bear a large proportionate increase in housing, plus the Winchfield part of “Others” would also bear a massive increase in housing, with Winchfield enduring a 6-fold increase during the plan period, with much more thereafter.

Proposed percentage increase in dwellings by parish in Hart District New Town 2001-2032

Proposed percentage increase in dwellings by parish in Hart District New Town 2001-2032


Proposed percentage increase in dwellings by parish in Hart District New Town Table 2001-2032

Proposed percentage increase in dwellings by parish in Hart District New Town Table 2001-2032

To us, this points to the need to redouble efforts to rebalance the housing proposals and redouble efforts to find a brownfield solution.

If you would like to ask Hart to abandon the new town and urban extension ideas and create a brownfield solution to our housing needs, we urge you to respond to the Hart District Council consultation about the Local Plan and ask them to think again. We have created a dedicated consultation page and updated our two guides to responding to the consultation that are available on the downloads below. The comments are designed to be cut and pasted into the boxes provided. It will be very powerful if you could edit the comments into your own words. Please do find time to respond to the consultation and play your part in saving our countryside.

Full version:

Responses to Local Plan Consultation

2 Minute version:

Respond to Local Plan Consultation in 2 minutes

Urban Areas not taking their fair share of homes part 2

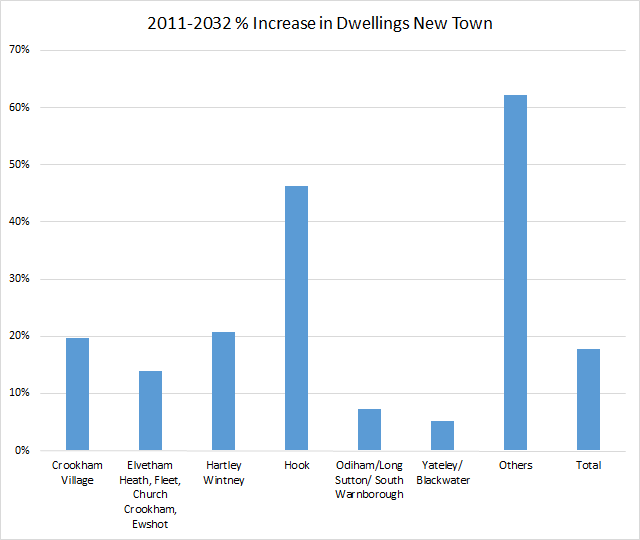
Proposed percentage increase in dwellings by parish in Hart District New Town

Proposed percentage increase in dwellings by parish in Hart District New Town

Further to our post of yesterday, that showed the impact by parish of following a dispersal strategy, we have now created graphs to show the impact by parish of urban extensions and a new town.  In each case, it shows that the urban areas of the district are not taking their fair share of housing.

This demonstrates to us the need to step up efforts to follow a brownfield strategy and re-find the 1,400 units on brownfield sites that Hart lost after saying that 1,800 units on brownfield land could be readily quantified back in September 2015.

First, let’s take at the new town strategy.  The chart showing the %-age increase in dwellings by parish from 2011 to 2032 if we followed a new town strategy to meet the remaining need from now on is shown above.  The table showing how this has been calculated is shown below:

Proposed percentage increase in dwellings by parish in Hart District New Town Table

Proposed percentage increase in dwellings by parish in Hart District New Town Table

Of course, only 2,000 of the full 5,000 will be delivered before 2032.  We have distributed these across Winchfield (in others) and Hook parish in the same ratio of the overall delivery shown in the SHLAA.  However, the secret plan from the Winchfield Consortium showed the Murrell Green sites would be developed first, so this may understate the impact on Hook.

Now, let’s take a look at the Urban Extension option.  he chart showing the %-age increase in dwellings by parish from 2011 to 2032 if we followed an urban extension strategy to meet the remaining need from now, together with the table showing how this has been calculated are shown below:

[Update: The West of Fleet urban extension is actually in Crookham Village Parish so chart and table updated to show that]

Proposed percentage increase in dwellings by parish in Hart District Urban Extensions 201-2032

Proposed percentage increase in dwellings by parish in Hart District Urban Extensions 201-2032


Proposed percentage increase in dwellings by parish in Hart District Urban Extensions Table 2001-2032

Proposed percentage increase in dwellings by parish in Hart District Urban Extensions Table 2001-2032

The urban extensions are at Pale Lane which is split across Elvetham Heath and Hartley Wintney parishes, west of Hook which is in Hook parish and west of Fleet (in Crookham Village Parish].

Finally, let’s re-look at the dispersal strategy, we covered in yesterday’s post:

Proposed percentage increase in dwellings by parish in Hart District - dispersal strategy

Proposed percentage increase in dwellings by parish in Hart District – dispersal strategy

Parish  2011 Census Dwellings 2011-2015 % of total  2011-2015 Number 2011-2015 % increase  Dispersal Proposal 2011-2032 % Increase
Crookham Village 1,630 7% 322 19.8% 177 31%
Elvetham Heath, Fleet, Church Crookham, Ewshot 14,879 45% 2,070 13.9% 466 17%
Hartley Wintney 2,222 10% 460 20.7% 290 34%
Hook 3,111 19% 874 28.1% 204 35%
Odiham/Long Sutton/ South Warnborough 3,142 5% 230 7.3% 583 26%
Yateley/ Blackwater 9,826 11% 506 5.1% 480 10%
Others 2,526 3% 138 5.5% 1,027 46%
Total 37,336 100% 4,600 12.3% 3,227 21%

If you would like to ask Hart to abandon the new town and urban extension ideas and create a brownfield solution to our housing needs, we urge you to respond to the Hart District Council consultation about the Local Plan and ask them to think again. We have created a dedicated consultation page and updated our two guides to responding to the consultation that are available on the downloads below. The comments are designed to be cut and pasted into the boxes provided. It will be very powerful if you could edit the comments into your own words. Please do find time to respond to the consultation and play your part in saving our countryside.

Full version:

Responses to Local Plan Consultation

2 Minute version:

Respond to Local Plan Consultation in 2 minutes


Fleet, Elvetham Heath, Crookham Village, Yateley, Blackwater and Ewshot not taking their fair share of housing

Proposed percentage increase in dwellings by parish in Hart District

Proposed percentage increase in dwellings by parish in Hart District.

Hart Council has published a lot of data related to the new consultation.  We have taken a look at it, come to the conclusion that the combination of the houses built or permitted since 2011, plus the proposals for dispersal show that our urban areas are not taking their fair share of housing. We think that Hart District should be trying harder to find brownfield sites in Fleet, Yateley and Blackwater to redress the balance and save our countryside (see slider of sites below).

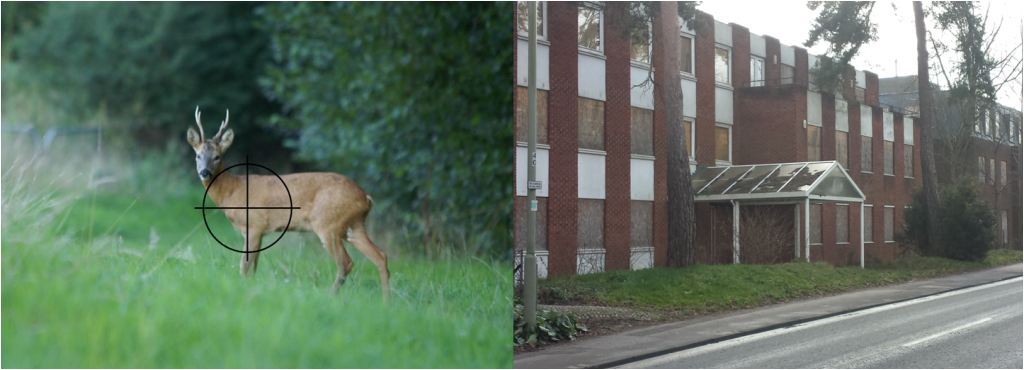
Which would you rather preserve - derelict eyesore or our wildlife?

Which would you rather preserve – derelict eyesore or our wildlife?

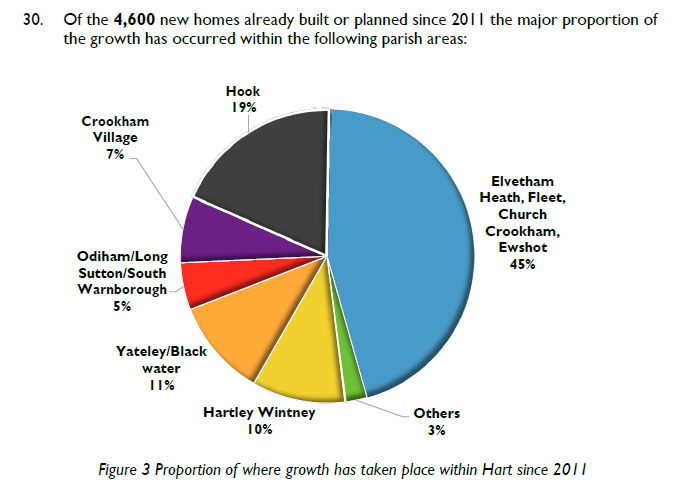
The chart above shows the %-age increase in dwellings by parish by combining the data shown in the table in para 30 of the main consultation document. This gives the distribution of dwellings built or permitted since 2011:

Split of dwellings built or permitted since 2011 by Parish

Split of dwellings built or permitted since 2011 by Parish

It did look odd to us that the parishes of Elvetham Heath, Fleet, Church Crookham and Ewshot should be grouped together like they were to give the impression that these parishes had already taken a lot of housing.  Of course if you combine a number of parishes together, then it is obvious that their combined contribution is going to be larger than the individual parishes to which they are compared.

So, we started with the census data for the number of dwellings by parish, and combined them together in the same way Hart had, then added on the number of houses implied by the figure above, then added the number of houses proposed by the dispersal option and expressed the result as a %-age increase on the number of dwellings that were there in 2011:

Parish  2011 Census Dwellings 2011-2015 % of total  2011-2015 Number 2011-2015 % increase  Dispersal Proposal 2011-2032 % Increase
Crookham Village 1,630 7% 322 19.8% 177 31%
Elvetham Heath, Fleet, Church Crookham, Ewshot 14,879 45% 2,070 13.9% 466 17%
Hartley Wintney 2,222 10% 460 20.7% 290 34%
Hook 3,111 19% 874 28.1% 204 35%
Odiham/Long Sutton/ South Warnborough 3,142 5% 230 7.3% 583 26%
Yateley/ Blackwater 9,826 11% 506 5.1% 480 10%
Others 2,526 3% 138 5.5% 1,027 46%
Total 37,336 100% 4,600 12.3% 3,227 21%

This shows that the urban areas that include Fleet, Yateley and Blackwater will take the lowest %-age increase in housing. Whereas, places like Hook, Hartley Wintney and the other rural parishes  are going to take massive %-age increases in housing.

Of course, a new town would disproportionately impact Winchfield, but would also lead to 1,800 further houses in Hook and effectively join those parishes to Hartley Wintney, into a giant Hartley WInchook conurbation.  Even the proposed urban extensions will further increase the pressure on Hartley Wintney and Hook.

One of the proposed extensions, the so-called Pale Lane extension (SHL 52) is largely in Hartley Wintney Parish, and another of the extensions is to the west of Hook (SHL 173).

If you would like to ask Hart to abandon the new town and urban extension ideas and create a brownfield solution to our housing needs, we urge you to respond to the Hart District Council consultation about the Local Plan and ask them to think again. We have created a dedicated consultation page and updated our two guides to responding to the consultation that are available on the downloads below. The comments are designed to be cut and pasted into the boxes provided. It will be very powerful if you could edit the comments into your own words. Please do find time to respond to the consultation and play your part in saving our countryside.

Full version:

Responses to Local Plan Consultation

2 Minute version:

Respond to Local Plan Consultation in 2 minutes


Which parishes have seen most development Hart District?

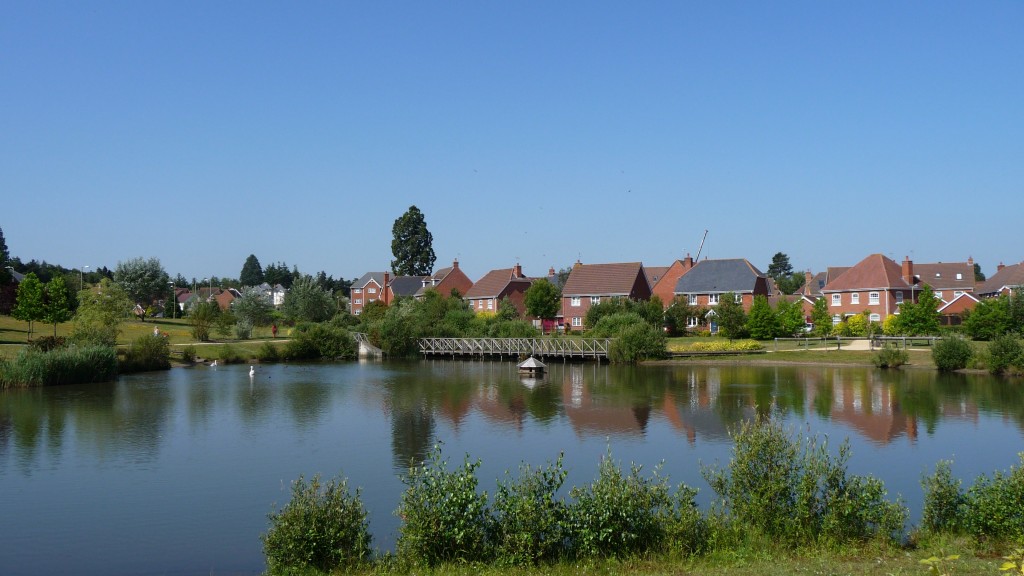
Elvetham Heath near Fleet, Hampshire

Elvetham Heath near Fleet, Hampshire

There has been much controversy about how much development there has been in Hart District over the past few years, so inspired by a post on the Winchfield Action Group site, we thought we’d take a closer look at the data.

We have compiled a list by parish and ward of the number of dwellings in each area in 2001 and 2011, according to the census and the results are shown in the table below:

ParishWard2001 Census (Dwellings)2011 Census (Dwellings)% Increase
Blackwater & Hawley177218675.4
Bramshill9863-35.7
Church Crookham330933280.6
Crondall6887387.2
Crookham Village156316304.3
Dogmersfield1241283.2
Eversley5996508.5
Ewshot2292352.6
FleetCentral2235256514.8
FleetCourtmoor188819282.1
FleetNorth (inc Elvetham Heath)13602947116.7
FleetPondtail182018984.3
FleetWest185719786.5
Fleet Total91601131623.5
Greywell1041040
Hartley Wintney212622224.5
Heckfield137135-1.5
Hook2718311114.5
Mattingley2322382.6
Odiham & Long Sutton271228806.2
Rotherwick2052123.4
South Warnborough21326223
Winchfield2392587.9
Yateley79427959.2
Total34170373369.3

It should be noted that the data only runs up to 2011 and so misses out most or all of certain developments such as QEB in Church Crookham, Dilly Lane and Rifle Range Farm in Hartley Wintney, Edenbrook and the planned new developments at Hawley Park Farm, new development to the North East of Hook and at Watery Lane.

It does show that the area with the largest increase is what was known as Fleet North, which has now been split after incorporating Elvetham Heath.

It is not really for us to point fingers at different areas of the district.  We will let readers make up their own mind and draw their own conclusions from the data.

If anyone finds an error in any of the data, then please do get in touch and we will make any corrections that are needed.

[Update]

I was asked to provide updated data of the permissions and completions since 2011.  There is no easy way to get this data.  This is a copy of what I received:

The majority of the information (with details of location and parish) on housing completions and permissions for the next few years can be found in the following two published documents :

Appendix 2&3
http://www.hart.gov.uk/sites/default/files/4_The_Council/Policies_and_published_documents/Planning_policy/Hart%205%20yr%20supply%20statement%20at%201st%20October%202015.pdf

And http://www.hart.gov.uk/sites/default/files/4_The_Council/Policies_and_published_documents/Planning_policy/Final%20Dwelling%20Completion%20Figures%202014-15_for%20website.xlsx

It’s regrettable  that you only used figures from the superseded five year land supply (2001-2011) calculation in the Interim Housing Delivery Strategy which was superseded by the Five Year Land Supply Position Statement:
Five Year Housing Land Supply Position Statement, 1st October 2015
2014-15, and the Completions list from Hampshire County Council (1st April 2015) both of which were linked on the  council website “Current planning policy and guidance” referring to the local plan consultation, and also discussed at a council meeting.

I’m glad got said you’d incorporate the latest numbers, and look forward to seeing this. I believe you’ll find disproportionate housing allocation to the North and East of the region whilst minimal development in the centre, West or south.

I can confirm that I used neither of the Housing Land Supply documents to produce the table above.  As the original post says, the source for the above is the census.

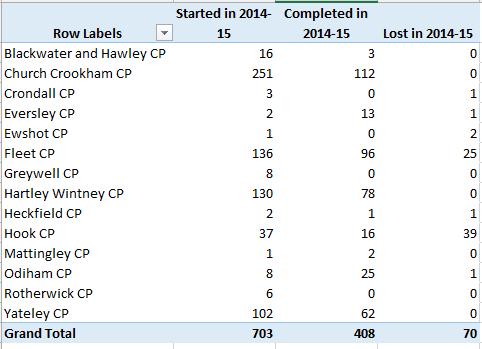
The link to the pdf just gives a long list of sites in a form that it is impossible to analyse in any meaningful way, least of all by parish.  The spreadsheet contains a list of starts, completions and losses for 2014-2015, a summary of which by Parish is shown below.

Dwellings started completed and lost in Hart District 2014-15

[/Update]

There is a brownfield solution to Hart’s housing needs

Vacant brownfield Block at Ancells Farm, Fleet, Hart District, Hampshire

Vacant Office at Ancells Farm, Fleet, Hampshire

We have done some further analysis on Hart’s Strategic Housing Land Availability Assessment (SHLAA) and come to the conclusion that Hart’s housing needs can be met from brownfield sites alone.  We believe this is a potentially viable solution that should form part of the forthcoming Housing Options consultation as part of the Local Plan.  Instead Hart Council have ignored the wishes of 2,130 people who signed the WeHeartHart petition and only put forward solutions that involve concreting over vast swathes of our countryside.

Created using the Donation Thermometer plugin https://wordpress.org/plugins/donation-thermometer/.2,350Hart District Brownfield Development Target3,993Hart District Brownfield Development Target170%

[Updated 2 March 2016 to add in the new brownfield SHLAA sites as described here]

[Updated 31 March 2016 to include Pyestock (aka Hartland Park)]

[Updated 30 August 2016 to re-set target to 2,350 now that Moulsham Lane, Yateley has been given the go ahead]

So, how have we arrived at our conclusion?

Brownfield sites in the SHLAA

We have been through the SHLAA and identified those sites that are mostly or wholly brownfield in nature, and added up total capacity as recorded in the SHLAA.  Pyestock (aka Hartland Park), is now also an official SHLAA site.  In total, these sites amount to between 3,208 and 3,250 homes at an average density of a relatively modest 28 dwellings per hectare (dph). The detail is shown in the table below:

ParishRef.NameBrownfield Capacity in Table 1 in DLPSite Assessment Capacity (Low)Site Assessment Capacity (High)Size (Ha.)Low Density (dpa)
Blackwater and HawleySHL21Linkwater Cottages, Blackwater12120.6418.75
Blackwater and HawleySHL100Sun Park, Guillemont Park North3003203201226.66
BramshillSHL106Bramshill (Police Training Centre)2502501025
Church CrookhamSHL2826/32 Bowenhurst Road8660.4214.28
Crookham VillageSHL158Crondall House, Fleet27271.1323.89
DogmersfieldSHL39Fermoy, Farnham Road5102.232.24
DogmersfieldSHL55Land at Church Lane, Dogmersfield20200.8224.39
Elvetham HeathSHL104Land at Elvetham Heath4545452.2520
EversleySHL127Land at Paul’s Field, Eversley70702.825
EversleySHL140Land off Warbrook Lane53531.7630.11
EwshotSHL36Dachs Lodge, Redfields, Church Crookham29291.224.16
EwshotSHL80Tanglewood, Ewshot770.3122.58
EwshotSHL174Peacocks Nursery Garden Centre1051053.530
EwshotSHL235Land at Willow Croft, Church Crookham50502.7518.18
FleetSHL41Imac Systems, Fleet6660.05120
FleetSHL42Camden Walk, Fleet9880.2433.33
FleetSHL50Waterfront Business Park, Fleet60601.4641.09
FleetSHL6918 Church Road, Fleet10100.07142.85
FleetSHL102Land at Bramshot Lane45451.825
FleetSHL113Thurlston House1712120.6817.64
FleetSHL245Land at 154-158 Albert Street & Fleet Road14880.1844.44
FleetSHL275Land at Little Mead, Fleet12171.0611.32
FleetSHL320Fleet Town Centre Zone 2201501501.883.33
FleetSHL322Fleet Town Centre Police Station1737370.6160.65
FleetSHL357Land at Sankey Lane, Fleet20200.6431.25
FleetTBAPyestock (aka Hartland Park)1,5001,50048.238.1
Hartley WintneySHL95Nero Brewery, Hartley Wintney660.1540
Hartley WintneySHL216Land adj. to James Farm Cottages, Hartley
Wintney
660.2920.68
HookSHL111Hook Garden Centre, Reading Road, Nr. Hook57574.4712.75
Long SuttonSHL296Old Dairy, Long Sutton550.225
OdihamSHL29Land at Butts End660.415
OdihamSHL66Rear garden of 4 Western Lane, Odiham16160.6425
OdihamSHL119Land at the rear of Longwood, Odiham990.3129.03
South WarnboroughSHL70Stables at Lees Cottage, South
Warnborough
550.2520
South WarnboroughSHL172Granary Court, South Warnborough16160.6923.18
WinchfieldSHL34Land adjoining Winchfield Court18251.0616.98
WinchfieldSHL84Land at Winchfield Lodge60603.815.78
WinchfieldSHL114Trimmers Cottage, Winchfield Hurst12120.4924.48
Church CrookhamSHL81Vertu, Beacon Hill Road, Church Crookham65701.7636.93
Blackwater and HawleySHL176Hawley House, Hawley8100.326.66
CrondallSHL178Broden Stables & Stable Yard, Crondall14271.410
CrondallSHL179Bowenhurst Lane, Crondall30351.520
Hartley WintneySHL189Land at James Farm, Hartley Wintney880.3125.8
Total3,2083,25011727.9

A number of these sites are “not currently developable” according to Hart.  But most of the green field sites they have put forward are also not currently developable.  We believe that the issues surrounding brownfield sites should capable of being resolved more easily than those for green field sites.

Sites not in the SHLAA

There are a number of sites not in the SHLAA that nevertheless should be considered that amount to around 785 additional homes.  These include the parts of Ancells Farm, Bartley Wood and Fleet High Street that have not already been permitted or counted elsewhere. We have also counted the complex of under-utilised offices that include Admiral House, Flagship House, Hart Offices and Harlington centre in Fleet.  Much of this site was recommended by Fleet Future, but for some reason Hart Council have ignored it.  But we can think of no reason why a council that was truly committed to a brownfield first strategy would not offer up its own under-utilised offices to be part of new, mixed use development and move to one of the other vacant office blocks in the district.  These sites, with an allowance for parts of sites that have already been permitted, are shown in the table below.

ParishSite DescriptionEstimated capacityNote
FleetAdmiral House, Flagship House, Hart Offices and Harlington centre350Paper by Gareth Price identified 775 units on a larger site incorporating much of this area
FleetAncells Farm370From Stonegate report
FleetFleet vacant offices220From Stonegate report
HookBartley Wood200From Stonegate report
Less units already granted permission or already counted-355Part of Ancells Farm and Barley Wood already granted. SHL 320 already counted
Total785

Conclusions

Drawing this together, there’s capacity for between 3,993 and 4,035 units on brownfield sites, without increasing the density on any of the SHLAA sites.

Now, according to Hart, we have to find space for a further 2,350 homes (now that 150 houses have been approved at Moulsham Lane, Yateley), according to the current Strategic Housing Market Assessment (SHMA).  This shows that we have now more than met our remaining needs from brownfield sites alone. We certainly do not need a new town at Winchfield or any new urban extensions in Hook, Fleet or Elvetham Heath.

However, we also know that Alan Wenban-Smith has challenged the SHMA and said that we need around 2,000 fewer houses.  If this were accepted by the inspector, we would have an even bigger surplus of brownfield capacity to take into the next planning period.

We also know that the SHMA is being revised, and the Government has published revised population and household forecasts earlier this year and these showed much lower figures for Hart.  Again, this should result in a lower housing allocation, and we would end up with a surplus of brownfield sites until the next planning period.

This begs the question why Hart Council is not including a formal brownfield option in its forthcoming consultation, when that was the clear view of the 2,130 people who signed the WeHeartHart petition.  Persisting with new town and urban extension solutions is untenable.  Please do get involved with this consultation and respond to it using our guide on our dedicated page about this consultation here.

Lock, stock and two smoking barrels

I present without further comment the contents of a letter I sent to Hart District Council yesterday (Friday 20 November 2015). Please do get involved with this consultation and respond to it using our guide on our dedicated page about this consultation here.

Errors, omissions and anomalies in the (Strategic Housing Land Availability Assessment) SHLAA and consultation materials

Dear Messrs Daryl Phillips and Stephen Parker,

It is clear that Hart Council has been very busy, publishing a vast array of new material about the SHLAA and the materials to be used in the forthcoming consultation about Housing Options.  I have burned a considerable amount of midnight oil going through those materials in some detail, and I have identified material errors, omissions and anomalies that give me serious cause for concern that I would like to share with you.  The Excel workbook containing the amalgamation of the SHLAA Master List, the NHB data and the SHLAA detail is attached for reference. These fall into several broad categories:

  • Assessment of brownfield site capacity and delivery
  • Deliverable and developable sites not included in the Developing a Local Plan for Hart paper (DLP) nor the New Homes Sites Booklet (NHB)
  • Sites missing from NHB but in the SHLAA
  • Discrepancies between capacity shown in NHB compared to SHLAA detail
  • Sites shown in detailed assessment but not in master list
  • Sites assessed as “not currently developable”, but have been granted planning permission
  • Range of meanings of “not currently developable”
  • Lack of consideration of the economic aspects of housing options 
  1. Assessment of brownfield site capacity and delivery.

There are a number of components to this:

In Hart News in September, and again at cabinet on 1 October, it was said that brownfield capacity had increased to 1,800 units. Now, this has miraculously fallen by 75% to 450 units on some dubious grounds. First, para 41 of the DLP states correctly that years 6-10 need only “developable” sites to be included, beyond that you can be more vague about sites.  We are already 4 years into the plan period and, according to the land supply calculation based on the current inflated SHMA, we have 5.7 years of land supply.  Yet, you are only selecting sites to be included in your calculations that meet the most onerous criterion of being “deliverable”.  As you know I have two FOI requests outstanding with you, the first is inquiring about the disposition of the 750 brownfield units that we were told were achievable back on November 2014, and the second asking for the analysis to support the 1,800 figure.  It seems to me you have inappropriately applied criteria that are too onerous in order to artificially reduce the potential brownfield capacity.  An example of this would be excluding Bramshill, when everyone knows it will be preferable for this site to undergo some sort of redevelopment to stop the Grade 1 listed building decaying and of course the hideous 1970’s accommodation blocks need replacing too.

You have under-stated the brownfield capacity in the DLP, compared to the assessed capacity in the SHLAA documents. This is shown in the table below:

Parish/Ref Sum of Site Assessment Capacity (Low) Sum of Site Assessment Capacity (High) Sum of Brownfield Capacity in Table 1 in DLP doc
Blackwater and Hawley 320 320 300
SHL100 320 320 300
Church Crookham 6 6 8
SHL28 6 6 8
Elvetham Heath 45 45 45
SHL104 45 45 45
Fleet 221 221 83
SHL113 12 12 17
SHL245 8 8 14
SHL320 150 150 20
SHL322 37 37 17
SHL41 6 6 6
SHL42 8 8 9
Grand Total 592 592 436


This shows that the capacity shown in the DLP (excluding the 20 units from the sites with planning permission) is some 156 units lower than your own assessments in the SHLAA documents with most of the discrepancy arising from sites SHL320 & 322.  Correcting this would reduce the net requirement by 156 units.

In Figure 2 of the DLP, you assert that 52% of the development completed or where permission has been granted since 2011 is on brownfield sites. Yet at September Council, a question was asked along similar lines and the response was “these figures exclude brownfield sites that require planning permission, because those are not currently split between greenfield and brownfield developments”.  This leads one to conclude either that you have simply made up the figures in the DLP, or you knowingly misled the Council and the public in September.  Which is it?

  1. Deliverable and developable sites not included

[updated with this note]

There’s a large number of deliverable and developable sites that are in the SHLAA but not apparently referred to in the DLP or the NHB.  A list if these is shown in the table below (some of which are in the NHB):

Parish/Ref Sum of NHB Capacity Sum of Site Assessment Capacity (Low) Sum of Site Assessment Capacity (High)
Blackwater and Hawley 320 320
SHL100 320 320
Church Crookham 6 6
SHL28 6 6
Elvetham Heath 45 45
SHL104 45 45
Fleet 25 243 248
SHL113 12 12
SHL245 8 8
SHL275 25 12 17
SHL320 150 150
SHL322 37 37
SHL41 6 6
SHL42 8 8
SHL69 10 10
Hartley Wintney 6 6
SHL95 6 6
Hook 550 550
SHL1&2 550 550
South Warnborough 16 16 16
SHL172 16 16 16
Grand Total 41 1,186 1,191

The land supply document shows a total of 3,878 units built, permitted or deliverable up until 1 April 2015, some 722 below the 4,600 figure you assert in the DLP.  I accept that 340 units from SHL1 & 2 and 10 from SHL69 are included in the land supply.  But the land supply does not include 300 units from Watery Lane.  Netting all of this off, then there are around 5,000 units already accounted for by being completed, permitted or deliverable, which would reduce the current net requirement by ~400 units compared to what you assert in the DLP.

  1. Sites missing from NHB but in the SHLAA

There are 76 units on sites in the SHLAA that are not already on the brownfield list and not strategic sites that do not appear in the NHB.  These are shown in the table below:

Parish/Ref Sum of NHB Capacity Sum of Site Assessment Capacity (Low) Sum of Site Assessment Capacity (High)
Fleet 10 10
SHL69 10 10
Hartley Wintney 6 6
SHL95 6 6
Heckfield 5 5
SHL157 5 5
Mattingley 48 48
SHL160 48 48
Yateley 7 7
SHL18 7 7
Grand Total 76 76


This raises the question as to why these sites have not been included in the NHB process either as selected or rejected sites.


  1. Discrepancies between capacity in NHB and SHLAA

There are material discrepancies between the site capacities shown in the NHB and those in the SHLAA.  Sometimes the NHB can be above the SHLAA figures and sometimes below.  But overall, adding up all of the sites where the NHB capacity is outside the range of SHLAA lower and upper limits, the NHB shows a lower capacity of some 1,500 units.  This demonstrates that the potential capacity of dispersal sites is being materially under-stated.  These sites are shown in the table in Appendix 1.


  1. Sites present in the detail of the SHLAA but not on the master list, and hence not in the NHB, nor mentioned in the DLP.

There are three sites, SHL167, 168 and 169 appear in the detailed assessments of sites, but not on the master list.

  1. Sites shown as “not currently developable” but have in fact been granted planning permission

Sites SHL68 and SHL117 are listed in the detail SHLAA documents as “not currently developable”, but according to the master list of sites have been granted planning permission.

  1. Range of meanings of “not currently developable”

It is clear from the above that the term “not currently developable” is a somewhat elastic phrase that can include sites that are just an administrative stroke of the pen away from deliverability as well as sites that face very significant challenges.  Many sites in the NHB and of course many of the strategic sites face very significant challenges that it is difficult to see how they can be remedied, such as proximity to flood zones, SSSI’s, SINCs, TPOs and the SPA and lack of proximity to existing settlements whereas others are much closer to deliverability.

However, the main materials being circulated for the consultation do not make this distinction clear.

  1. Lack of discussion about economics

The discussion about infrastructure costs in the DLP, with the only mention of costs being the woefully [inadequate] £30m for a new motorway junction – I would think there is little chance of change out of £100m.  But even so this misses out other important infrastructure items like the local road system, new or upgraded railway station, widening of the railway bridges over the local roads, new sewage farm, burying overhead power lines, new schools and new healthcare facilities to name but a few.  Hart currently has a £78m infrastructure funding deficit, Hampshire as a whole £1.9bn and the local NHS is predicted to have a large annual funding deficit.

These issues associated with a new town should be spelled out in detail, and I would think many of the same issues will arise with urban extensions.

It is certainly true that these issues will need to be resolved before the Local Plan can be found sound at examination.

So, what are we to conclude from the above?  First, the discrepancies outlined above, once corrected will make a very material difference to the calculation of how many more houses we need to build on green field sites (if any) and the capacity of each parish to deliver them.  I do not wish to subscribe to conspiracy theories.  However, the sum-total of the above, coupled with the obvious single-minded desire on the part of some members to push through a new town at all costs, leads me to conclude that either the people who created these consultation documents were incompetent or they are by their omission or intent about to mislead the public.   It is also clear that whatever systems and processes you are using to plan, manage, monitor and control the SHLAA are completely inadequate with such large discrepancies between different views of the same data.

It is clear to me that the forthcoming consultation should be postponed until these discrepancies are ironed out.

I would like you to treat this letter as a formal complaint and respond according to LGO guidelines.  I might also add that I will copy this letter to the chairman of the Standards Committee to ask him to set up an investigation and to our Local MP.  You might expect this letter and your response to be presented as evidence in any examination of the Local Plan.

Yours sincerely,


cc:           Peter Kern, Chairman of Hart DC Standards Committee

Ranil Jayawardena, MP


Appendix 1:

Parish/Ref Sum of NHB Capacity Sum of Site Assessment Capacity (Low) Sum of Site Assessment Capacity (High)
Blackwater and Hawley 15 12 12
SHL21 15 12 12
Bramshill 300 250 250
SHL106 300 250 250
Crondall 112 130 130
SHL159 65 100 100
SHL72 16 18 18
SHL76 31 12 12
Crookham Village 70 100 100
SHL53 70 100 100
Dogmersfield 40 5 10
SHL39 40 5 10
Eversley 91 123 123
SHL127 50 70 70
SHL140 41 53 53
Ewshot 120 187 187
SHL174 63 105 105
SHL355 48 75 75
SHL80 9 7 7
Fleet 706 881 886
SHL102 43 45 45
SHL275 25 12 17
SHL333 500 750 750
SHL50 46 60 60
SHL51 92 14 14
Hartley Wintney 208 287 301
SHL155 117 194 194
SHL216 8 6 6
SHL35 34 3 17
SHL45 25 51 51
SHL91 10 11 11
SHL97 12 10 10
SHL99 2 12 12
Heckfield 169 45 65
SHL109 44 5 5
SHL257 62 20 30
SHL259 63 20 30
Hook 2,090 3,849 3,849
SHL123 13 20 20
SHL3 543 1,000 1,000
SHL4 458 1,800 1,800
SHL5 1,065 1,000 1,000
SHL6 11 29 29
Long Sutton 63 65 65
SHL296 6 5 5
SHL335 34 35 35
SHL336 23 25 25
Mattingley 130 40 60
SHL239 55 20 30
SHL240 75 20 30
Odiham 3,308 2,894 2,904
SHL108 387 160 160
SHL110 2,160 1,900 1,900
SHL138 204 261 261
SHL228 48 75 75
SHL29 10 6 6
SHL328 25 30 30
SHL329 44 30 30
SHL57 47 75 75
SHL59 115 175 175
SHL60 11 12 12
SHL65 36 50 50
SHL67 53 80 80
SHL78 168 40 50
Rotherwick 130 200 200
SHL86 130 200 200
South Warnborough 36 20 25
SHL70 7 5 5
SHL75 29 15 20
Winchfield 119 32 42
SHL114 11 12 12
SHL262 108 20 30
Yateley 9 60 60
SHL13 0 8 8
SHL149 0 10 10
SHL17 0 30 30
SHL303 9 12 12
Grand Total 7,716 9,180 9,269

See more at our consultation page:

link
Petition Response: Make the most of brownfield land

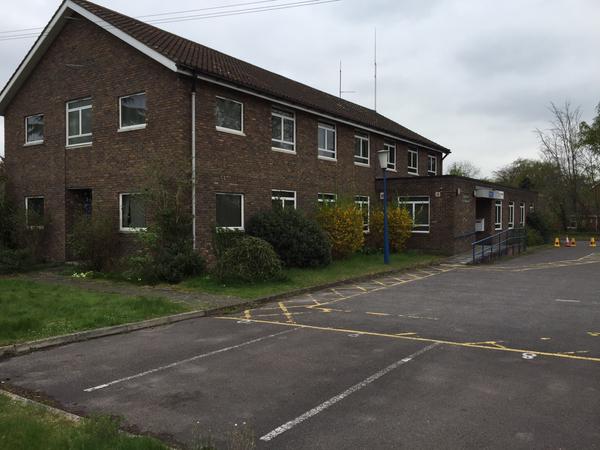
Old Police Station in Fleet, Hart District, Hampshire

Old Police Station in Fleet, Hampshire

As we posted earlier, we have submitted the We  Hart petition with 2,130 responses to Hart District Council and the council have set out the process by which they will consider the petition.

We have drafted some suggestions as to how the council should respond  and sent them to Council leader, Stephen Parker.  We have a chance to put these ideas to Cabinet on 1 October at 7pm.  Please tell us if you are coming along to give us your support and please e-mail your councillors to ask them to support these proposals and incorporate them into the forthcoming consultation about the Local Plan.

The full set of suggestions can be found here.

The suggestions in this post relate to making the most of the brownfield opportunity.

Last November, the council’s estimate of brownfield capacity over the entire plan period was around 750 units (taken from parts 1 and 3 of the SHLAA as per the FOI request we made) out of the then remaining 4,000 units to build (or grant permission for) up to 2032.  Since then considerable progress has been made in identifying and in some cases granting permission on additional brownfield sites:

LocationNumber of Dwellings
Guillemont Park Phase 1 (not included as brownfield site in SHLAA) 150
Guillemont Park Phase 2320
Ancells Farm, Fleet370
Bartley Wood, Hook200
Fleet Road, Fleet220
Bramshill House350
Fleet Police Station50
Extra dwellings at Landata House28
Total1,688

All of the dwellings above were not included as brownfield sites in the SHLAA.  Guillemont Park (Sun Park) was in the SHLAA but for a lower number of units, and in Part 2, which was not considered to include brownfield locations.  Since last November revised permission has been granted at Landata House for 28 more dwellings than were included in the 5 year land supply calculation.

If the original 750 units were to be added to the 1,688 units identified above, then that amounts to a total of 2,438 potential units on brownfield.  If it were possible to increase the density (from 30dph to a still reasonable 80dph in urban areas) on the original 750 units, the total identified capacity would rise to some 3,688 units.

The remaining requirement of 4,000 has of course been reduced by the unfortunate decisions to allow development at Watery Lane (300 units) and Hawley Park Farm (126 units) leaving the remaining allocation at 3,574.

It is clear that with some creativity and energy, the gap between the remaining allocation of 3,574 and the currently identified brownfield capacity can be closed by working on a combination of reducing the overall allocation by reducing the SHMA or applying environmental “policy on” considerations, increasing density and finding more brownfield sites.

In the light of this, we welcome the paper that has been put before Cabinet, signalling the more positive approach that the council proposes towards building housing on previously developed land.

We would ask though, that you consider some further steps from our 5-point plan:

  • Creating a new, formal “reasonable suitable alternative” option of meeting the remaining housing allocation solely through brownfield development.  This option should appear in the consultation paper.
  • Creating a complete database of all of the potential brownfield sites in the district, including those not in the October 2014 SHLAA and those not yet formally promoted to the council, including sites such as Bramshill House, Pyestock, Sun Park, Ancells Farm, Bartley Wood, Fleet High St, Fleet Police Station and all of the run down town centres (e.g. Fleet, Yateley, Blackwater and Hook).
  • Inviting leading architects to compete to produce some visionary outline schemes of what a “brownfield solution” might look like for the district, taking into account changing demographics, changing shopping habits driven by the internet and achievable housing densities.
  • Organising a conference with the architects, land owners, developers and local community representatives with the objective of identifying the art of the possible for brownfield development amongst the competing solutions from the architects.


Employment Space (sq m)
Overall Requirement to 2032 (a)266,368
Current vacant space (b)527,840
Sites with planning permission (c)338,187
Surplus in 2032 (b+c-a)599,659


How Hart Council should respond to the We Heart Hart petition

Vacant brownfield Block at Ancells Farm, Fleet, Hart District, Hampshire

Vacant Office at Ancells Farm, Fleet, Hampshire

As we posted earlier, we have submitted the We  Hart petition to Hart District Council and the council have set out the process by which they will consider the petition.

We have drafted some suggestions as to how the council should respond  and sent them to Council leader, Stephen Parker and they are shown below.  We have a chance to put these ideas to Cabinet on 1 October at 7pm.  Please tell us if you are coming along to give us your support.

Please e-mail your councillors to ask them to support these proposals.


Dear Stephen,

Thank you very much for your email.

As you know the petition is from 2,130 signatories, nearly four times the number that responded to Hart Council’s consultation last year and more than ten times the number of people who expressed a first preference for a new town and is therefore a very significant expression of local opinion.

I welcome your approach to treat the petition seriously.  My understanding is that a petition of over 1,000 signatories would trigger an automatic debate at full council.  However, I do believe a debate at Cabinet is more likely to be more productive, so I support the approach you suggest.

As you might expect, I have my own suggestions as to what the appropriate responses to the petition should be and I set them out below for your consideration, interwoven with the petition objectives:

  1. To reduce the overall housing allocation for Hart District

 I think there are two broad approaches to this.  First, challenge the SHMA to reduce the overall housing allocation for the whole HMA.  If this is successful, then it will have a two-fold effect of reducing Hart’s own need and also reducing the risk of overflow from Surrey Heath and Rushmoor.  I believe the key arguments are around inward migration assumptions; average household size and in particular jobs growth assumptions which are at a rate nearly double what was achieved over the economic cycle from 1998-2012 and will result in unprecedented levels of participation in the labour market (rising from around 70% to around 86%) for those of employment age.  I gave more detail on these arguments at both the Hop Garden Road appeal and in my response to the Rushmoor Local Plan.  More detail can be found here. However, I do recognise it is difficult for the council to challenge its own document and I await Rushmoor’s response to my strong challenge, but I do understand that the SHMA may be re-visited and it would be helpful if the council would commit to challenging the assumptions set out above as part of that process.

Second, in conversation with a number of professionals in the planning sector, I have been told a number of times, that it is uncommon for councils to explore fully their “policy on” options with regard to environmental and other constraints.  One of the main attractions of Hart as a district is its rural environment with associated SPA, SSSI’s, SINCs, green space and wildlife.  May I suggest that a proper environmental study is carried out to set out the value of Hart’s environment and ecology to build an argument for not meeting the full requirement of the SHMA?  I know that WAG is working on some proposals in this area with some of the rural parishes and would be keen to discuss the matter with you and offer to share the costs of preparation. 

  1. Demand that the Council develops a vision and strategy for Hart that retains its role as a rural, green hinterland for NE Hampshire that respects the separate character and identity of Hart’s settlements and landscapes and preserves the green spaces as amenity space for the urban settlements.

You may recognise the words above as taken from the withdrawn 2013 Core Strategy.  This was, and remains a good vision.  I would ask that as a minimum, the forthcoming Regulation 18 consultation sets out at least one potential “vision” for the district, and that one of the “vision” options includes words to this effect.

  1. To require that the housing need is met by building on brownfield sites and increasing density in our existing urban areas

Last November, the council’s estimate of brownfield capacity over the entire plan period was around 750 units (taken from parts 1 and 3 of the SHLAA as per the FOI request I made) out of the then remaining 4,000 units to build (or grant permission for) up to 2032.  Since then considerable progress has been made in identifying and in some cases granting permission on additional brownfield sites:

LocationNumber of Dwellings
Guillemont Park Phase 1 (not included as brownfield site in SHLAA) 150
Guillemont Park Phase 2320
Ancells Farm, Fleet370
Bartley Wood, Hook200
Fleet Road, Fleet220
Bramshill House350
Fleet Police Station50
Extra dwellings at Landata House28
Total1,688

All of the dwellings above were not included as brownfield sites in the SHLAA.  Guillemont Park (Sun Park) was in the SHLAA but for a lower number of units, and in Part 2, which was not considered to include brownfield locations.  Since last November revised permission has been granted at Landata House for 28 more dwellings than were included in the 5 year land supply calculation.

If the original 750 units were to be added to the 1,688 units identified above, then that amounts to a total of 2,438 potential units on brownfield.  If it were possible to increase the density (from 30dph to a still reasonable 80dph in urban areas) on the original 750 units, the total identified capacity would rise to some 3,688 units.

The remaining requirement of 4,000 has of course been reduced by the unfortunate decisions to allow development at Watery Lane (300 units) and Hawley Park Farm (126 units) leaving the remaining allocation at 3,574.

It is clear that with some creativity and energy, the gap between the remaining allocation of 3,574 and the currently identified brownfield capacity can be closed by working on a combination of reducing the overall allocation by reducing the SHMA or applying environmental “policy on” considerations, increasing density and finding more brownfield sites.

In the light of this, I welcome the paper that is to be put before Cabinet next week, signalling the more positive approach that the council proposes towards building housing on previously developed land.

I would ask though, that you consider some further steps:

  • Creating a new, formal “reasonable suitable alternative” option of meeting the remaining housing allocation solely through brownfield development.  This option should appear in the consultation paper.
  • Creating a complete database of all of the potential brownfield sites in the district, including those not in the October 2014 SHLAA and those not yet formally promoted to the council, including sites such as Bramshill House, Pyestock (aka Hartland Park), Sun Park, Ancells Farm, Bartley Wood, Fleet High St, Fleet Police Station and all of the run down town centres (e.g. Fleet, Yateley, Blackwater and Hook).
  • Inviting leading architects to compete to produce some visionary outline schemes of what a “brownfield solution” might look like for the district, taking into account changing demographics, changing shopping habits driven by the internet and achievable housing densities.
  • Organising a conference with the architects, land owners, developers and local community representatives with the objective of identifying the art of the possible for brownfield development amongst the competing solutions from the architects.
  • This could be done in conjunction with the neighbouring authorities of Surrey Heath and Rushmoor, particularly given the massive amount of current and forecast vacant employment land and Rushmoor seeking to protect 96 Ha.
  1. To request that future housing stock reflects the needs of the changing demographics of the district.

I set out in a question to council earlier this year that Hart will need to deliver around 2,500 housing units to meet the needs of the ageing population.  I contend that a new town will simply build the wrong type of accommodation in the wrong place to meet those needs.  It would be far better if these were built on brownfield sites in more urban areas, close to amenities such as doctors, post offices, shops and so on.  When the elderly move into these types of development, their well-being improves and of course, they free up conventional housing stock for families.  Could I therefore ask that the forthcoming consultation paper contains specific proposals on how the needs of the ageing population will be met?

  1. To demand the council and government do not plan for any new settlement in Hart that will act as a sink for the unmet housing need in neighbouring areas.

Addressing points 1, 2, 3 & 4 will render a new town unnecessary particularly when you consider the:

I do hope you find these suggestions helpful.  I would be grateful if you could circulate them to planning officers and Cabinet members for their consideration.

Please help Hart fend off an extra 1,600 houses from Rushmoor

Is this what we want Hart to turn into?

Is this what we want Hart to turn into?

Rushmoor Borough Council has published a draft Local Plan where it proposes to build only 8,200 of its assessed need of 9,822 houses over the plan period.  It is clear that Rushmoor is seeking to offload the remaining 1,622 houses on to Hart District.

We need to oppose this move and We Heart Heart have produced some materials to help you do this easily.  Our voice will have greater weight if we can get more Hart residents to comment on Rushmoor’s plan than Rushmoor residents. Please follow the simple process below:

  1. Download the Local Plan response form from the link below.
  2. On page 3, fill in your name and contact details and type your name and date in the boxes at the bottom of the page.
  3. Review the comments made and feel free to add, amend or delete as you see fit.
  4. Save the document, attach it to an email and send to [email protected]
  5. Share a link to this page to all your friends and family as well as any sports clubs or community groups you belong to via word of mouth, email, Facebook and Twitter and ask them to put in a response and share this page again.
  6. If you have not already done so, please sign and share our petition too.
Rushmoor Local Plan Response Form

A summary of the arguments we are putting forwards is outlined below.

Slippery slope to taking more housing than the other districts

The proposal to take an additional 1,622 houses from Rushmoor puts us on the slippery slope to accepting a further 1,400 houses from Surrey Heath such that Hart District ends up having to build the most houses in the Housing Market Area.


Hart DistrictSurrey Heath BoroughRushmoor BoroughTotal Housing Market Area
Original SHMA7,5347,0579,82224,413
Proposed Transfers3,022(1,400)(1,622)0
New Total10,5565,6578,20024,413


This will impact all of our districts including Blackwater and Hawley; Bramshill;  Church Crookham; Crondall; Crookham Village; Dogmersfield; Elvetham Heath; Eversley; Ewshot; Fleet; Greywell; Hartley Wintney; Heckfield; Hook; Mattingley; North Warnborough; Odiham; Rotherwick; South Warnborough; Winchfield; and Yateley adding additional pressure to an already difficult situation and make it more likely we have to accept both a new town and urban extensions on our beautiful green fields and countryside.

Hart and the rest of Housing Market Area are being asked to build too many houses

The whole Housing Market Area (HMA) should reduce the assessed need by 7,800 units which would reduce the pressure on Hart directly and remove the need for Surrey Heath and Rushmoor to ask us to build >3,000 houses for them. This is discussed in more detail here.

Rushmoor isn’t making best use of its brownfield sites

This is discussed in more detail here and here. As can be seen, if Rushmoor gets more creative with Wellesley and plans to build on the sites it has already identified, there is potential capacity for over 30,000 dwellings, more than three times its (overblown) assessed need.   It surely cannot be too much to expect them to find the 1,600 houses they say they can’t build out of this wealth of opportunity.  Rushmoor Borough Council should re-visit its planned densities and seek to meet all of its assessed need within in its own boundaries.  It could then make some sites available for neighbouring rural districts in line with a recent survey of Hampshire residents seeking to protect rural areas.  Neighbouring districts could be approached to provide SANG capacity if required.  Rushmoor should also take a closer look at all the vacant sites in the district and seek to convert them to residential use.

Rushmoor’s Employment Land Review is overblown and seeks to protect more employment land than is necessary.

This is discussed here.  It is also clear that past forecasts got it wrong as evidenced by the large number of vacant office blocks and empty shops across Hart District.  If the ELR was reduced to more sensible levels they could free up more land for housing.

Indeed, even if you accept the overblown employment forecasts, there will be a surplus of nearly 600K sq m of employment space at the end of the plan period, covering around 195 Ha.  Yet Rushmoor seeking to protect 96 Ha of land whilst asking Hart to build 1,600 houses on green fields.

Rushmoor’s infrastructure plans are not credible

We posted here that Hampshire as a whole has a £1.9bn infrastructure funding deficit, with Rushmoor’s share of that being £80m.  Rushmoor makes no mention of this deficit in its draft Local Plan.  Hart’s own numbers show an infrastructure deficit of £78m.  All of these numbers are probably an under-statement given they were all produced before the scale of development now proposed was known.  This is in contravention of NPPF para 177 that says there must be a “reasonable prospect” of delivering the required infrastructure alongside housing:

“It is equally important to ensure that there is a reasonable prospect that planned infrastructure is deliverable in a timely fashion. To facilitate this, it is important that local planning authorities understand district-wide development costs at the time Local Plans are drawn up. For this reason, infrastructure and development policies should be planned at the same time, in the Local Plan”

Finally, they don’t even attempt to quantify the extra infrastructure Hart would need to build the extra 1,600 houses nor do they make any offer to fund any of that extra cost.

Rushmoor not planning to meet the needs of the ageing population

Figure 10.15 of the SHMA sets out the need for specialist housing and registered care places for the HMA and Rushmoor.  This states Rushmoor must build 710 sheltered and extra care units as well as provide an extra 600 registered care places. Their draft Local Plan makes no mention of the extra registered care places and sets no target for the sheltered and extra care units.  This is in contravention of NPPF para 50 which states:

“local planning authorities should…plan for a mix of housing based on current and future demographic trends, market trends and the needs of different groups in the community (such as, but not limited to, families with children, older people, people with disabilities, service families and people wishing to build their own homes)”

Therefore the Rushmoor draft Local Plan runs the risk of being found unsound and should be revised.


In conclusion, the Rushmoor draft Local Plan contains many serious flaws and needs to be revised.

Link