Rushmoor seeking to protect 96 hectares of brownfield sites but asking Hart to concrete over green fields

Empty Offices at Farnborough Aerospace Business Park, Rushmoor Borough, Hampshire.

Empty Offices at Farnborough Aerospace Business Park, Rushmoor Borough, Hampshire.

Rushmoor have released more details about their Land Assessment (SHLAA) that reveal they are seeking to protect over 96 hectares of brownfield sites for employment use even though there is a massive glut of employment space across Hart, Rushmoor, Surrey Heath and surrounding districts.

Rushmoor Protected Employment Sites

Rushmoor Protected Employment Sites

If even half of this was used for housing at 100 dwelling per hectare, it would yield 4,800 houses for people in Rushmoor and would mean that Rushmoor could meet its own housing need and even take some of Hart and Surrey Heath’s allocation.

If you would like to ask Rushmoor to revise their Local Plan and make better use of the brownfield sites they have, then please follow the simple process below:

  1. Download the Local Plan response form from the link below.
  2. On page 3, fill in your name and contact details and type your name and date in the boxes at the bottom of the page.
  3. Review the comments made and feel free to add, amend or delete as you see fit.
  4. Save the document, attach it to an email and send to [email protected]
  5. Share a link to this page to all your friends and family as well as any sports clubs or community groups you belong to via word of mouth, email, Facebook and Twitter and ask them to put in a response and share this page again.
  6. If you have not already done so, please sign and share our petition too


Rushmoor Local Plan Response Form


Massive surplus of brownfield employment land but Rushmoor wants Hart to concrete over green fields

Empty Offices at Farnborough, Rushmoor Borough, Hampshire.

Empty Offices at Farnborough, Rushmoor Borough, Hampshire.

The Employment Land Review (ELR) shows there is a massive surplus of around 600K sq m employment space occupying around 195 Ha of land across the combined area of Hart District, Surrey Heath and Rushmoor Boroughs. Yet, Rushmoor is seeking to protect 96 hectares of this land whilst at the same time trying to force Hart to build 1,600 houses for them on our beautiful green fields.

Employment Space (sq m)
Overall Requirement to 2032 (a)266,368
Current vacant space (b)527,840
Sites with planning permission (c)338,187
Surplus in 2032 (b+c-a)599,659

If you would like to ask Rushmoor to revise its draft local plan, please download our pre-prepared response form and send it to [email protected].


Rushmoor Local Plan Response Form


The analysis to support the conclusion is shown below.  We posted earlier that the ELR is based on the same flawed jobs forecasts as the housing market assessment that predict a near doubling of the job creation rate we achieved in the period 1998-2012.  However, even if you accept these flawed forecasts and the unnecessary increase in housing it will lead to, the requirement for employment land in the combined economic area is 266K sq m using Rushmoor’s preferred Scenario 3.

Employment Land Requirements for Hart, Surrey Heath and Rushmoor

Employment Land Requirements for Hart, Surrey Heath and Rushmoor

However, as of December 2014, over 527K sq m of employment floorspace was lying vacant.

Vacant Employment Space in Hart Surrey Heath and Rushmoor

Vacant Employment Space in Hart Surrey Heath and Rushmoor

Moreover, there is a glut of employment space all across neighbouring districts with very high levels of vacant office space (note that there are also high vacancy rates on industrial land):

Office vacancy rates in neighbouring districts

Office vacancy rates in neighbouring districts

In addition to the vacant units shown above, there is currently 388K sq m of floorspace on 110 Ha of land that currently has planning permission but is not yet being built:

Unimplemented planning permission in Hart Surrey Heath and Rushmoor

Unimplemented planning permission in Hart Surrey Heath and Rushmoor

Drawing this together, there is a need for 266,000 sq m of space to meet the inflated employment forecasts, there’s currently 527,000 sq m lying vacant, with a further 338,000 sq m with planning permission, but not yet built.  This would leave a surplus of nearly 600,000 sq m of employment space that might occupy around 195 Ha of land, using the same ratio of employment space to land use as the existing planning permissions.

It is clearly ridiculous for all of this land to be protected when even if say 100 Ha is made available, at 100 dwellings per hectare there could be room for 10,000 dwellings, a very large proportion of the overall 24,413 houses that have been allocated to Hart, Surrey Heath and Rushmoor.

Rushmoor protecting acres of vacant offices and asking Hart to build 1,600 houses for them

Empty Offices at Farnborough, Rushmoor Borough, Hampshire.

Empty Offices at Farnborough, Rushmoor Borough, Hampshire.

Rushmoor Borough Council is seeking to protect acres of empty, brownfield office sites, but at the same time it is asking Hart to build 1,600 houses for them because Rushmoor says it can’t meet its own need.  If Hart is forced to take all these houses it makes it more likely we will have to build a new town and concrete over our beautiful green fields and countryside.

Bravehart has been out and about again and taken photos of 15 vacant employment sites across Rushmoor.  This is far from a comprehensive assessment of all of the vacant sites in Rushmoor, but it does illustrate the scale of the opportunity available. It has subsequently emerged that Rushmoor want to protect 96 Ha of brownfield land even though their own Employment Land Review predicted a massive surplus at the end of the plan period.

  • We Heart Hart's Mascot - Bravehart
    We Heart Hart's Mascot - Bravehart

Rushmoor has recently published its draft Local Plan and has asked for comments from the public.  If you are a Hart District resident and you would like them to re-visit their plan and build all of their own need on their own patch, then you can use the pre-prepared from on the link below.  All you need to do is:

  1. Download the Local Plan response form from the link below.
  2. On page 3, fill in your name and contact details and type your name and date in the boxes at the bottom of the page.
  3. Review the comments made and feel free to add, amend or delete as you see fit.
  4. Save the document, attach it to an email and send to [email protected]
  5. Share a link to this page to all your friends and family as well as any sports clubs or community groups you belong to via word of mouth, email, Facebook and Twitter and ask them to put in a response and share this page again.
  6. If you have not already done so, please sign and share our petition too.
Rushmoor Local Plan Response Form


More detail here.


Empty Offices at Southwood Business Park, Rushmoor Borough, Hampshire.

Empty Offices at Southwood Business Park, Rushmoor Borough, Hampshire.

Empty Offices at Southwood Business Park, Rushmoor Borough, Hampshire.

Vacant Offices at Southwood Business Park, Rushmoor Borough, Hampshire.

Empty Offices at Southwood Business Park, Rushmoor Borough, Hampshire.

Empty Offices at Southwood Business Park, Rushmoor Borough, Hampshire.

Empty Offices at Southwood Business Park, Rushmoor Borough, Hampshire.

Empty Offices at Southwood Business Park, Rushmoor Borough, Hampshire.

Empty Offices at Cody Technology Business Park, Rushmoor Borough, Hampshire.

Empty Offices at Cody Technology Business Park, Rushmoor Borough, Hampshire.

Empty Offices at Farnborough Business Park, Rushmoor Borough, Hampshire.

Vacant Offices at Farnborough Business Park, Rushmoor Borough, Hampshire.

Empty Offices at Farnborough, Rushmoor Borough, Hampshire.

Empty Offices at Farnborough, Rushmoor Borough, Hampshire.

Empty Offices at Farnborough, Rushmoor Borough, Hampshire.

Empty Offices at Farnborough, Rushmoor Borough, Hampshire.

Empty Offices at Farnborough Business Park, Rushmoor Borough, Hampshire.

Empty Offices at Farnborough Business Park, Rushmoor Borough, Hampshire.

Empty Offices at Farnborough Aerospace Business Park, Rushmoor Borough, Hampshire.

Empty Offices at Farnborough Aerospace Business Park, Rushmoor Borough, Hampshire.

Empty Offices at Farnborough Aerospace Business Park, Rushmoor Borough, Hampshire.

Empty Offices at Farnborough Aerospace Business Park, Rushmoor Borough, Hampshire.

Empty Offices at Farnborough Aerospace Business Park, Rushmoor Borough, Hampshire.

Empty Offices at Farnborough Aerospace Business Park, Rushmoor Borough, Hampshire.

Empty Offices at Farnborough Aerospace Business Park, Rushmoor Borough, Hampshire.

Empty Offices at Farnborough Aerospace Business Park, Rushmoor Borough, Hampshire.

Empty Offices at near Aldershot, Rushmoor Borough, Hampshire.

Empty Offices at near Aldershot, Rushmoor Borough, Hampshire.

Empty Offices at Southwood Business Park, Rushmoor Borough, Hampshire.

Empty Offices at Southwood Business Park, Rushmoor Borough, Hampshire.


Rushmoor has potential capacity for over 30,000 homes

Rushmoor Borough Council SHLAA Analysis

Rushmoor Borough Council SHLAA Analysis

In an earlier post, we highlighted how Rushmoor is not making the best use of the land set aside for the Wellesley (aka Aldershot Urban Extension) development.  Modern planning techniques could increase the yield of that site to over 21,500 dwellings.

We Heart Hart has now been given access to Rushmoor’s full SHLAA.  This shows that outside Wellesley, Rushmoor have identified 60.51Ha with a planned density of 51dph yielding 3,083 units. In addition, 128.74Ha are shown where they are not currently planning to build any houses (zero yield sites).  If these sites were planned to deliver at the same 51dph, they would yield an additional 6,560 units.  Without changing Wellesley, this would bring the available total capacity up to 13,493 units (or density could be increased on the 60.51Ha), far in excess of the assessed need of 9,822.

As can be seen, if Rushmoor gets more creative with Wellesley, and plans to build on the sites it has already identified, there is potential capacity for over 30,000 dwellings, more than three times its (overblown) assessed need.   It surely cannot be too much to expect them to find the 1,600 houses they say they can’t build and what to foist on to Hart District.  Rushmoor Borough Council should re-visit its planned densities and seek to meet all of its assessed need within in its own boundaries.  It could then make some sites available for neighbouring rural districts in line with a recent survey of Hampshire residents seeking to protect rural areas.  Neighbouring districts could be approached to provide SANG capacity if required.

This analysis will form part of our response to Rushmoor’s draft Local Plan.


Rushmoor can meet all of its housing needs (and more) from Wellesley alone

Wellesley - Aldershot Urban Extension - Planning Densities

Wellesley – Aldershot Urban Extension – Planning Densities

The centrepiece of Rushmoor’s development strategy in the draft Local Plan is the Wellesley development (formerly known as the Aldershot Urban Extension).

This is a 143 hectare development where they are planning to build 3,850 new houses.  This amounts to a pitiful density of only 26.9 dwellings per hectare (dph) across the whole area, even lower than Hart’s planning assumption of 30dph.  Across the plots digitised by Gareth Price, the density rises to 35.5dph whcih is still very low for an urban area.

If Rushmoor were to alter the plans for Wellesley to an easily achievable 68.7dph, they could meet the entire assessed housing need  of 9,822 up to 2032 without even touching the other sites in their SHLAA leaving additional capacity for future years or for neighbouring districts.

Modern planning techniques as outlined by Gareth Price, suggests that thriving, sustainable communities can be created in urban areas with planning densities in the range of 150-250dph.  Moving to around 152dph would give them capacity at Wellesley for over 21,500 units, giving sufficient capacity for Rushmoor for decades to come.

This analysis will form part of our response to Rushmoor’s draft Local Plan.


Hart District and Rushmoor can meet their housing needs from brownfield sites for 50 years or more

Hartland Park (Pyestock) near Fleet, Hart District, Hampshire, warehouse development not started

Brownfield site: Hartland Park (Pyestock) near Fleet, Hart District, Hampshire

A new paper by young architecture graduate, Gareth Price shows that Hart District and Rushmoor Borough could build 49,000 homes on brownfield sites by shedding the old models of the past and adopting a more modern approach of building higher density developments in existing urban areas.  This would avoid urban sprawl and protect our green fields to act as amenity space for the enjoyment of all.

Gareth’s document goes through many of the brownfield sites in both Hart and Rushmoor and applies modern techniques to demonstrate how more can be made of existing land to build more affordable homes on brownfield sites in urban areas to meet the needs of younger people who are struggling to get on the housing ladder and the elderly who will more, smaller more manageable homes closer existing amenities and infrastructure.

The paper illustrates also illustrates where these techniques have been applied in London and on the continent to create vibrant, cohesive communities.

This paper is exactly the sort of thing that We Heart Hart had in mind when we put forward our 5-point plan for improving Hart’s approach to the Local Plan where we called for a competition to be held amongst architects to illustrate the art of the possible on our brownfield sites and provide a vision to guide the regeneration of our urban town centres as an alternative to endless urban sprawl across our green fields.

No doubt there will be some who will disagree with the level of development intensity Gareth proposes for some areas in Hart, where he concludes we could build 25,000 homes on them.  However, it is clear that the capacity of the brownfield sites he has studied is very much greater than the 700 dwellings Hart has said we could deliver over the period up to 2032.  Indeed, according to our brownfield monitor the capacity is already up to 2,360 units in just 6 months.  We must challenge Rushmoor to make more of their brownfield sites.

The paper can be downloaded below:


A sustainable approach to building on brownfield sites in Hart District and Rushmoor


Link

Hart Council rolls over and starts to plan for an extra 1,600 houses from Rushmoor

Is this what we want Hart to turn into?

Do we want Hart District to turn into an urban sprawl?

We Heart Hart understands that at the Local Plan Steering Group last week councillors were told that they will have to start planning for an extra 1,600 houses from Rushmoor.  We have previously warned that by planning for a new town, Hart was creating capacity that would force it to take the unmet needs of Surrey Heath and Rushmoor. Indeed the advice from Peter Village QC was that Hart should pursue the duty to cooperate discussions in a “robust and inquisitive manner”.

This would take Hart’s target to 2032 up to 9,134, up from the current (in our view overblown) target of 7,534.  This is simply wasting the good work that has identified additional brownfield capacity in the district.

However, Hart Council’s actions are going much further than the advice they received from the Planning Inspector as recently as March 2015:

“Tactically, Hart should show to an inspector that it acknowledges the housing problem, and accept that it is likely to have to take an element of unmet need now. This would show an inspector that Hart is being reasonable in the circumstances. In practice this could mean taking an element of Rushmoor’s need now, but dealing with further shortfalls in Rushmoor and Surrey Heath through an early review once there is more certainty over what those authorities can deliver. Hart would need to quantify the amount of unmet need it is agreeing to take in its plan. It would also need to justify why it’s not taking all the unmet need.”

So, far from taking “an element” of Rushmoor’s need now, they are proposing to plan to take the whole lot.  Of course there are no reports yet of how they are going to close the existing £78m funding gap, let alone how to fund the extra infrastructure required to support the extra 1,600 houses we have to build for Rushmoor.

The whole reason why we are being put in this position is that the combined housing market area of Hart and Rushmoor and Surrey Heath Boroughs is being asked to build too many houses because the Strategic Housing Market Assessment (SHMA) is based on some dodgy forecasts.  If the SHMA was brought down to more realistic levels, then neither Rushmoor nor Surrey Heath would have a shortfall.

We need to challenge Rushmoor’s plan now.  We have created a template letter, together with an up to date distribution list of all of the Hart District Councillors and it is available for download below.  Please download it, and all you need to do is cut and past the contents into an email; choose your local councillor email adresses;  add your name and address; alter the contents as you see fit and send it off.  We have also created a template document for challenging Rushmoor’s plan.

Letter to Hart Councillors rejecting proposal to take 1,600 houses from Rushmoor
Rushmoor Local Plan Response Form


Please sign and share our petition and support our 5-point plan to change course:


Go to Petition


This story has been covered in Get Hampshire.


Link

Hart District is being asked to build too many houses

Housing Market Area Migration and housing capacity

Figure 1: Housing Market Area Migration and housing capacity

Hart District is being asked to build 7,534 houses in the planning period up to 2032 (now 9,134 as Hart is starting to plan for an additional 1,600 houses from Rushmoor).  This target is based on the Objectively Assessed Housing Need (OAHN) contained in the Strategic Housing Market Assessment (SHMA) carried out by Hart District and Rushmoor and Surrey Heath Boroughs. We believe this target is too high because the SHMA is based on a number of flawed assumptions:

  • Inward migration assumptions unrealistic
  • Average household size unreasonable
  • Jobs growth forecasts not credible
  • Overall adjustments lead to building rate higher than national requirement

These are set out in more detail below and in the submission to the Owens Farm (Hop Garden Road), Hook appeal. The overall impact of correcting these errors would be to reduce Hart District’s overall housing target to around 6,100 units and crucially reduce Rushmoor and Surrey Heath’s target so they don’t need to ask Hart to build 3,100 houses for them.  This will mean that Hart will be able to satisfy the rest of its target from brownfield development alone and won’t need a new town at Winchfield or anywhere else.

Inward Migration Assumptions Unrealistic

Inward migration to this or any other district represents a “want” of people living elsewhere to live in Hart and not a “need”.  Many people may desire to live in Hart because it is one of the best places to live in the country, but no-one “needs” to move to live here in the strict sense of the word.  Indeed inward migration to Hart represents the unmet needs of other districts.  If Government policy is followed, then the housing, employment, education and other “needs” of the people “wanting” to move to Hart should be met by the local authorities where they currently live and thus the apparent need for housing in Hart arising from inward migration should substantially reduce.  There is no evidence presented in the SHMA to evaluate the impact of reduced inward migration to Hart from other districts as a result of those districts now being forced to meet their own needs, nor the impact of the implementation of the Northern Powerhouse.  Indeed London has now agreed to meet its own housing need in full, which should reduce the scale of inward migration to the HMA.

Notwithstanding the above, the SHMA makes a subjective judgement to cherry pick inward migration data from 2005-2010 as being the “most realistic” approach to take to future demographic modelling.  Moreover, it uses spurious statistical analysis to try to infer causation from a weak correlation (R2=~0.65) between housing completions and inward migration.  This is inherently flawed for a number of reasons outlined below.

First, of course it is self-evident that the period during which the HMA delivered most housing was when inward migration was highest.  However, as was argued above, this scale of inward migration represents unmet needs of other districts rather than the unmet needs of Hart.

Second, the period when we were building most and attracting most inward migration was during one of the longest uninterrupted periods of economic growth in history, supported by a large structural deficit in the national accounts and the biggest credit binge of all time.  Of course it ended in a spectacular bust and can in no way be described as a “normal” or “sustainable” set of economic conditions.  The economic conditions we are seeing now with more moderate growth linked to the need for the Government, companies and people to live within their means and reduce debt will be the situation for the foreseeable future and thus represent a more “normal” situation.

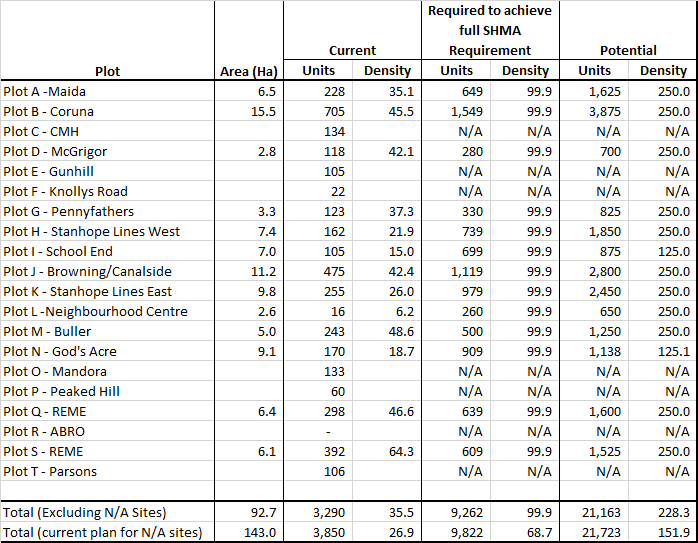
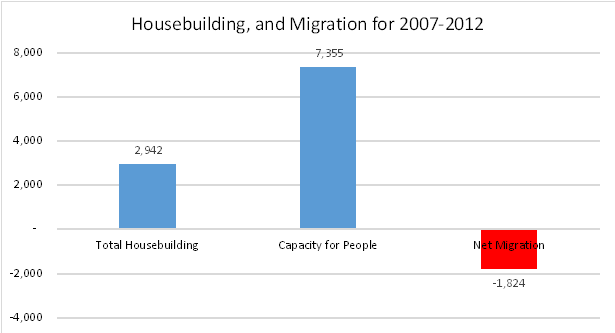
The period 2007-2012 includes the final year of the boom, the recession and the now more moderate pace of economic growth that surely more closely represents future conditions.  Indeed, as Figure 1 shows (data taken from Fig. 7.4 of the SHMA on p71) taking the period 2007-2012, the HMA delivered 2,942 new dwellings which at an average of 2.5 people per dwelling created capacity for an extra 7,355 people to live in the area.  Despite that, the HMA experienced an overall outward migration of 1,824 people.  It surely cannot be considered sound to base the future housing “need” on increasing inward migration projections when recent data shows that in fact the HMA is undergoing net outward migration despite creating significant capacity for more people to live here.

Accordingly, the additional 1,210 houses postulated in the SHMA arising from inward migration should be removed from the housing “need”.

Average Household Size Forecasts Unreasonable

Average Houshold Size projections for Housing Market Area

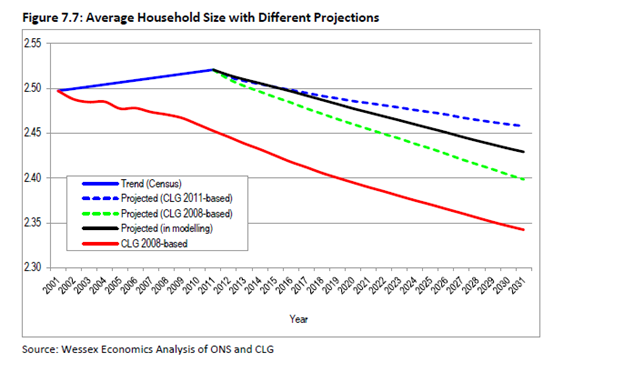
Figure 2: Average Household Size projections for Housing Market Area


Figure 7.7 of the SHMA (reproduced as Figure 2 above) shows that the trend in household size as measured by the census is slightly upward for the period from 2001 to 2011. This is in direct contradiction to both the 2008-based and 2011-based CLG projections.  Yet the forward projections used in the SHMA reverse the trend shown in actual data in the census and persist with the inaccurate forecasts of a continuing fall in the average household size.

Part of the justification for this is given as “at the time of the 2011 Census, the British economy was still in recession”.  This is factually incorrect as a cursory examination of the GDP numbers on the BBC website shows that the economy came out of recession in mid-2009.  It seems the forecasting “experts” are at a loss to properly explain this reversal of trend.

Moreover, given that the starting point for the SHMA projections is DCLG sourced figures, it would be somewhat odd for the DCLG forward projections not to include its own forecasts for household size.  There is therefore a significant risk that this part of the SHMA has double counted erroneous household size projections.

It is therefore inappropriate continue to assume a continuing downward trend in household size.  Surely a more prudent assumption would be to assume that the current household size is maintained and update that assumption and the SHMA as more real data comes to light.

Accordingly, the 1,500 additional houses in the SHMA related to the flawed household size assumption should be removed.

Jobs Growth Forecasts not Credible

The SHMA uses a set of jobs growth assumptions that are based on forecasts that are vastly in excess of what has been achieved in the most recent economic cycle.

The SHMA contains data on the historic rates of job growth for the HMA.  This shows two sets of data that are derived from different sources and cover different time periods (Figures 4.3 & 4.4 of the SHMA).

First, there is the period 1998-2008, covered by ABI data.  This shows overall job growth in the period of 7,200, or 720 per annum for the 10 year period with a compound annual growth rate (CAGR) of 0.6%.  Second there are different BRES sourced data for the periods of 2009-2012. The BRES data from 2009-2012 shows total jobs growth of 200, or 67 per annum for the 3 years in question or a CAGR of 0.05%.

Discontinuity between ABI and BRES jobs data for Housing Market Area

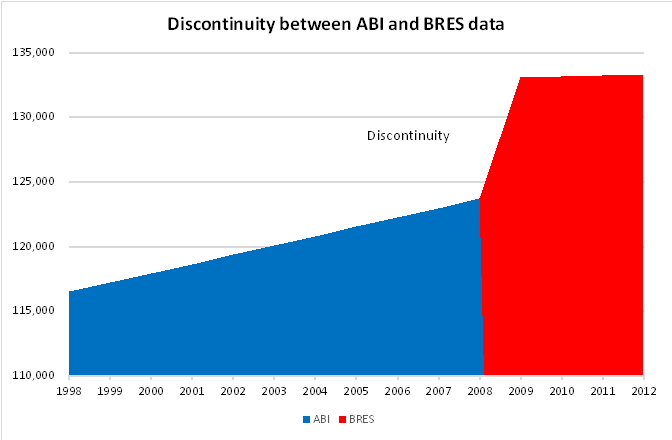
Figure 3: Discontinuity between ABI and BRES jobs data for Housing Market Area

Figure 3 shows a comparison of the BRES data and the ABI data that demonstrates the discontinuity between 2008 and 2009, with a jobs increase of nearly 10,000 when we know the economy was in the teeth of a deep recession. Note that the report states that the ABI and BRES data cannot be directly compared because they are compiled using different methods. It is therefore clear that each period (and dataset) should be treated separately and independently rather than splicing them together.

Treating the datasets separately would indicate total jobs growth over the economic cycle of 7,400, or 529 per annum or a CAGR of 0.41%, based on backward extrapolation of the BRES data.

Taking this 0.41% rate of growth as a future projection would mean we would add 11,332 overall jobs over the period of 2012-2032 at an average rate of 567 total jobs per annum.

However, the SHMA uses as its central assumption that future jobs growth of 1,130 per annum will be achieved, equating to a CAGR of ~0.79%, nearly double what was achieved over the most recent economic cycle and far higher than that achieved during the unsustainable boom of 1998-2008.  Given the constraints on Government spending and tighter credit conditions that are likely to persist for some time due to tighter bank regulation, it is inconceivable that we will achieve an economic growth rate nearly twice that achieved during the last economic cycle. Figure 4 shows the comparison of these growth rates.

Hart Surrey Heath and Rushmoor Jobs Growth rates 1998 to 2013 compared to SHMA

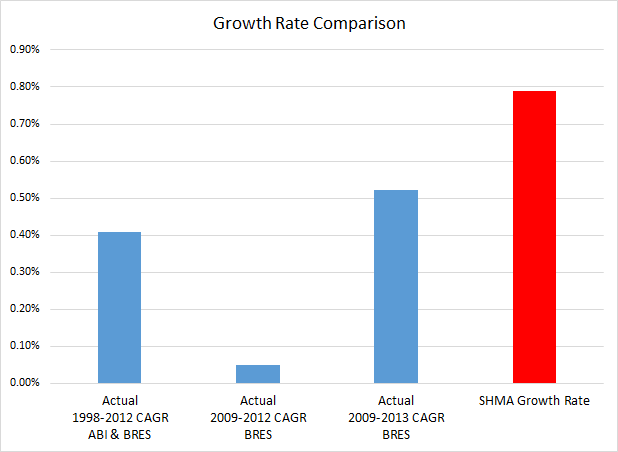
Figure 4: Hart Surrey Heath and Rushmoor Jobs Growth rates 1998 to 2013 compared to SHMA

Little justification for this is given other than it is based on Experian forecasts. The recent job creation history (2009-2012) showed jobs growth of 67 per annum as we came out of the recession.  67 jobs per annum equates to less than 6% of the jobs that the SHMA assumes we will create. Revised figures for 2013 demonstrate a CAGR of jobs growth from 2009-2013 at 0.52%, still well below the SHMA projections at a time the UK as a whole is creating more jobs than the rest of the EU put together.  This demonstrates that the Experian forecasts are pie in the sky and it beggars belief that such unproven Experian forecasts should take precedence over the actual real world achievement.

A further illustration of the outlandish nature of the Experian forecasts is given in para 7.70 of the SHMA.  In its forecast published in 2013, Experian assumes there were 145,000 jobs in the HMA in 2011.  Whereas the 2011 Census says there were only 122,300 and the BRES data says 125,000.  How can we trust Experian to forecast the future when it can’t even get the the past right?

Even the Employment Land Review produced by Rushmoor Borough Council described the Experian forecasts as:

“Experian-derived forecasts which are considered unreliably high in that they make too many assumptions around unconstrained economic growth”

The SHMA also says at para 7.85:

“…there are many ways labour markets can adjust to an increase in demand for labour that do not require an increase in the resident workforce. In summary these are:

  • A reduction in unemployment
  • A rise in economic activity rates
  • A shift away from part time working to full time working
  • An increase in double jobbing
  • A reduction in out-commuting
  • An increase in in-commuting

None of these changes require an increase in resident population, and all of them will be stimulated if
wage and salary levels increase.

In the modelling, allowance has been made for only one of these effects…”

No explanation is given for not taking into account the other ways in which the labour market can adjust.

In addition, if one compares the jobs forecasts to the population forecasts, the overall forecasts imply a massive, unrealistic increase in the percentage of people of working age in employment as can be seen in the table below:


Data Point2011 (Census)2011 (BRES)2031 (PROJ 2)2031 (PROJ 5)
SHMA Population (a) 272,394 272,394 307,578 322,278
People in employment (b) 122,300 125,000 162,233 170,223
Overall % in employment (b/a)44.9%45.9%52.7%52.8%
People over 70 (c) 28,559 28,559 51,164 51,164
People 5-19 (d) 67,375 67,375 73,206 73,206
People of working age (a-c-d)=e 176,460 176,460 183,208 197,908
% working age in employment (b/e)69.3%70.8%88.6%86.0%

This shows an increase from around 70% of working age people in employment to 86-88%.  No justification for this increase is given anywhere.

From the above, it is clear that the employment forecasts are outlandishly large and the SHMA does not even take into account most of the ways in which jobs can increase without leading to a need for more housing.  It is clear we should not be basing our housing requirement on such forecasts.

Figure 4.1 of the SHMA demonstrates that Hart in particular and the whole HMA enjoy high levels of employment and unemployment levels that are below the regional and national averages.

Therefore, the number of jobs to be created in the future should at least partially be a matter of “want” rather than “need”.  The future employment targets should be based on a realistic assessment of the capacity of the economy to create jobs in the private sector as it is these jobs that will support the largely state sector jobs in education and health that will be required to support the increased population.

As noted above para 7 of the NPPG states that local communities should be involved

“from the earliest stages of plan preparation, which includes the preparation of the evidence base in relation to development needs”.

Moreover, a recent legal opinion from Peter Village QC has said:

“There has been no regulation 18 consultation at all on issues such as employment, retail, transport, infrastructure (or, indeed, anything other than housing distribution). It is inconceivable that a coherent and sound local plan could emerge without addressing most (at least) of these issues.”

It therefore follows that the local community should be consulted upon the employment targets it wishes to set and the related scale of development required to meet that target.  No such consultation has taken place, nor is it planned which represents a significant flaw in the Local Plan process. The evidence from the petition indicates that local people are more likely to express a preference for a lower level of development.

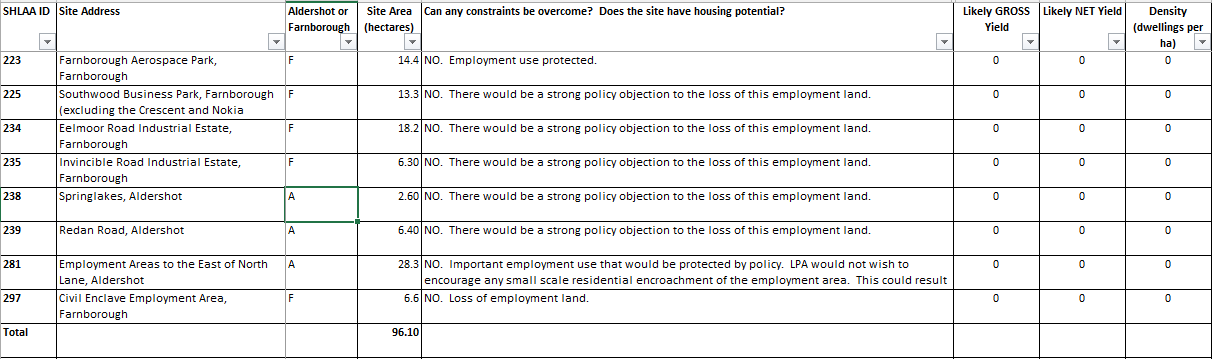
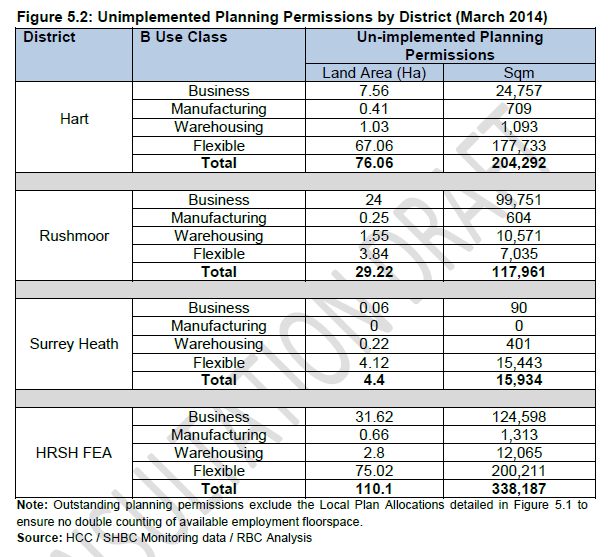
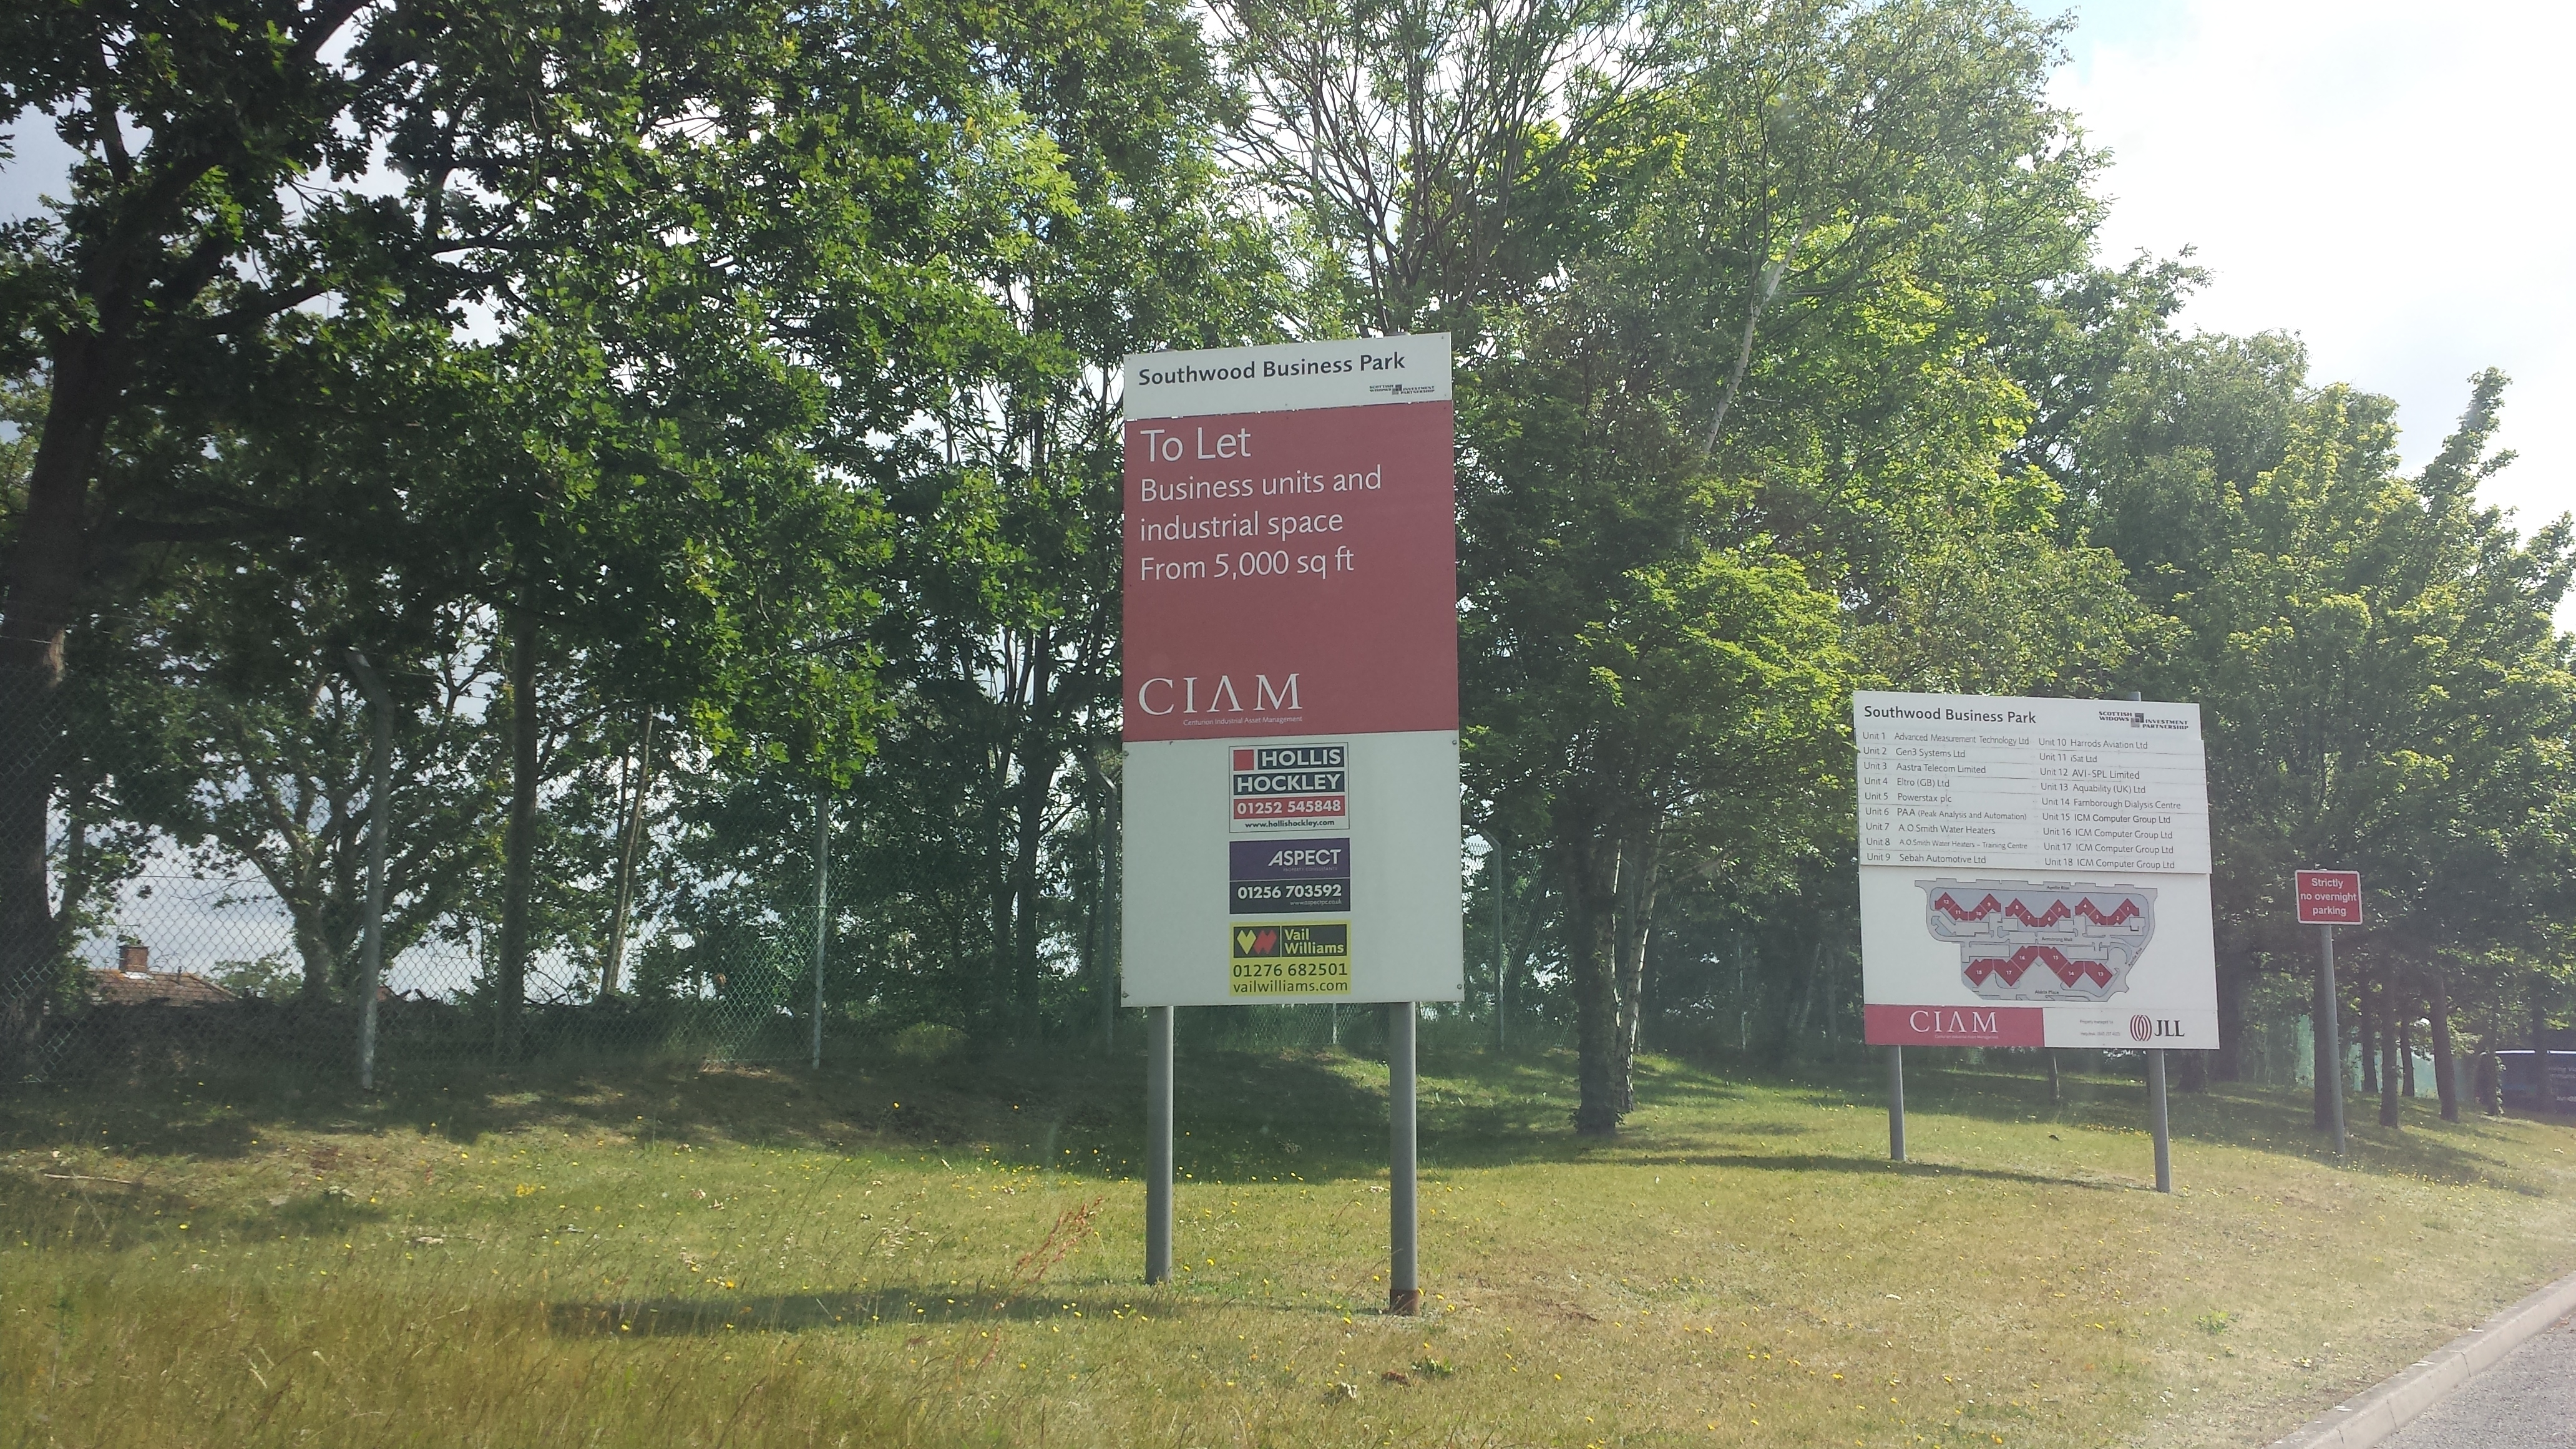
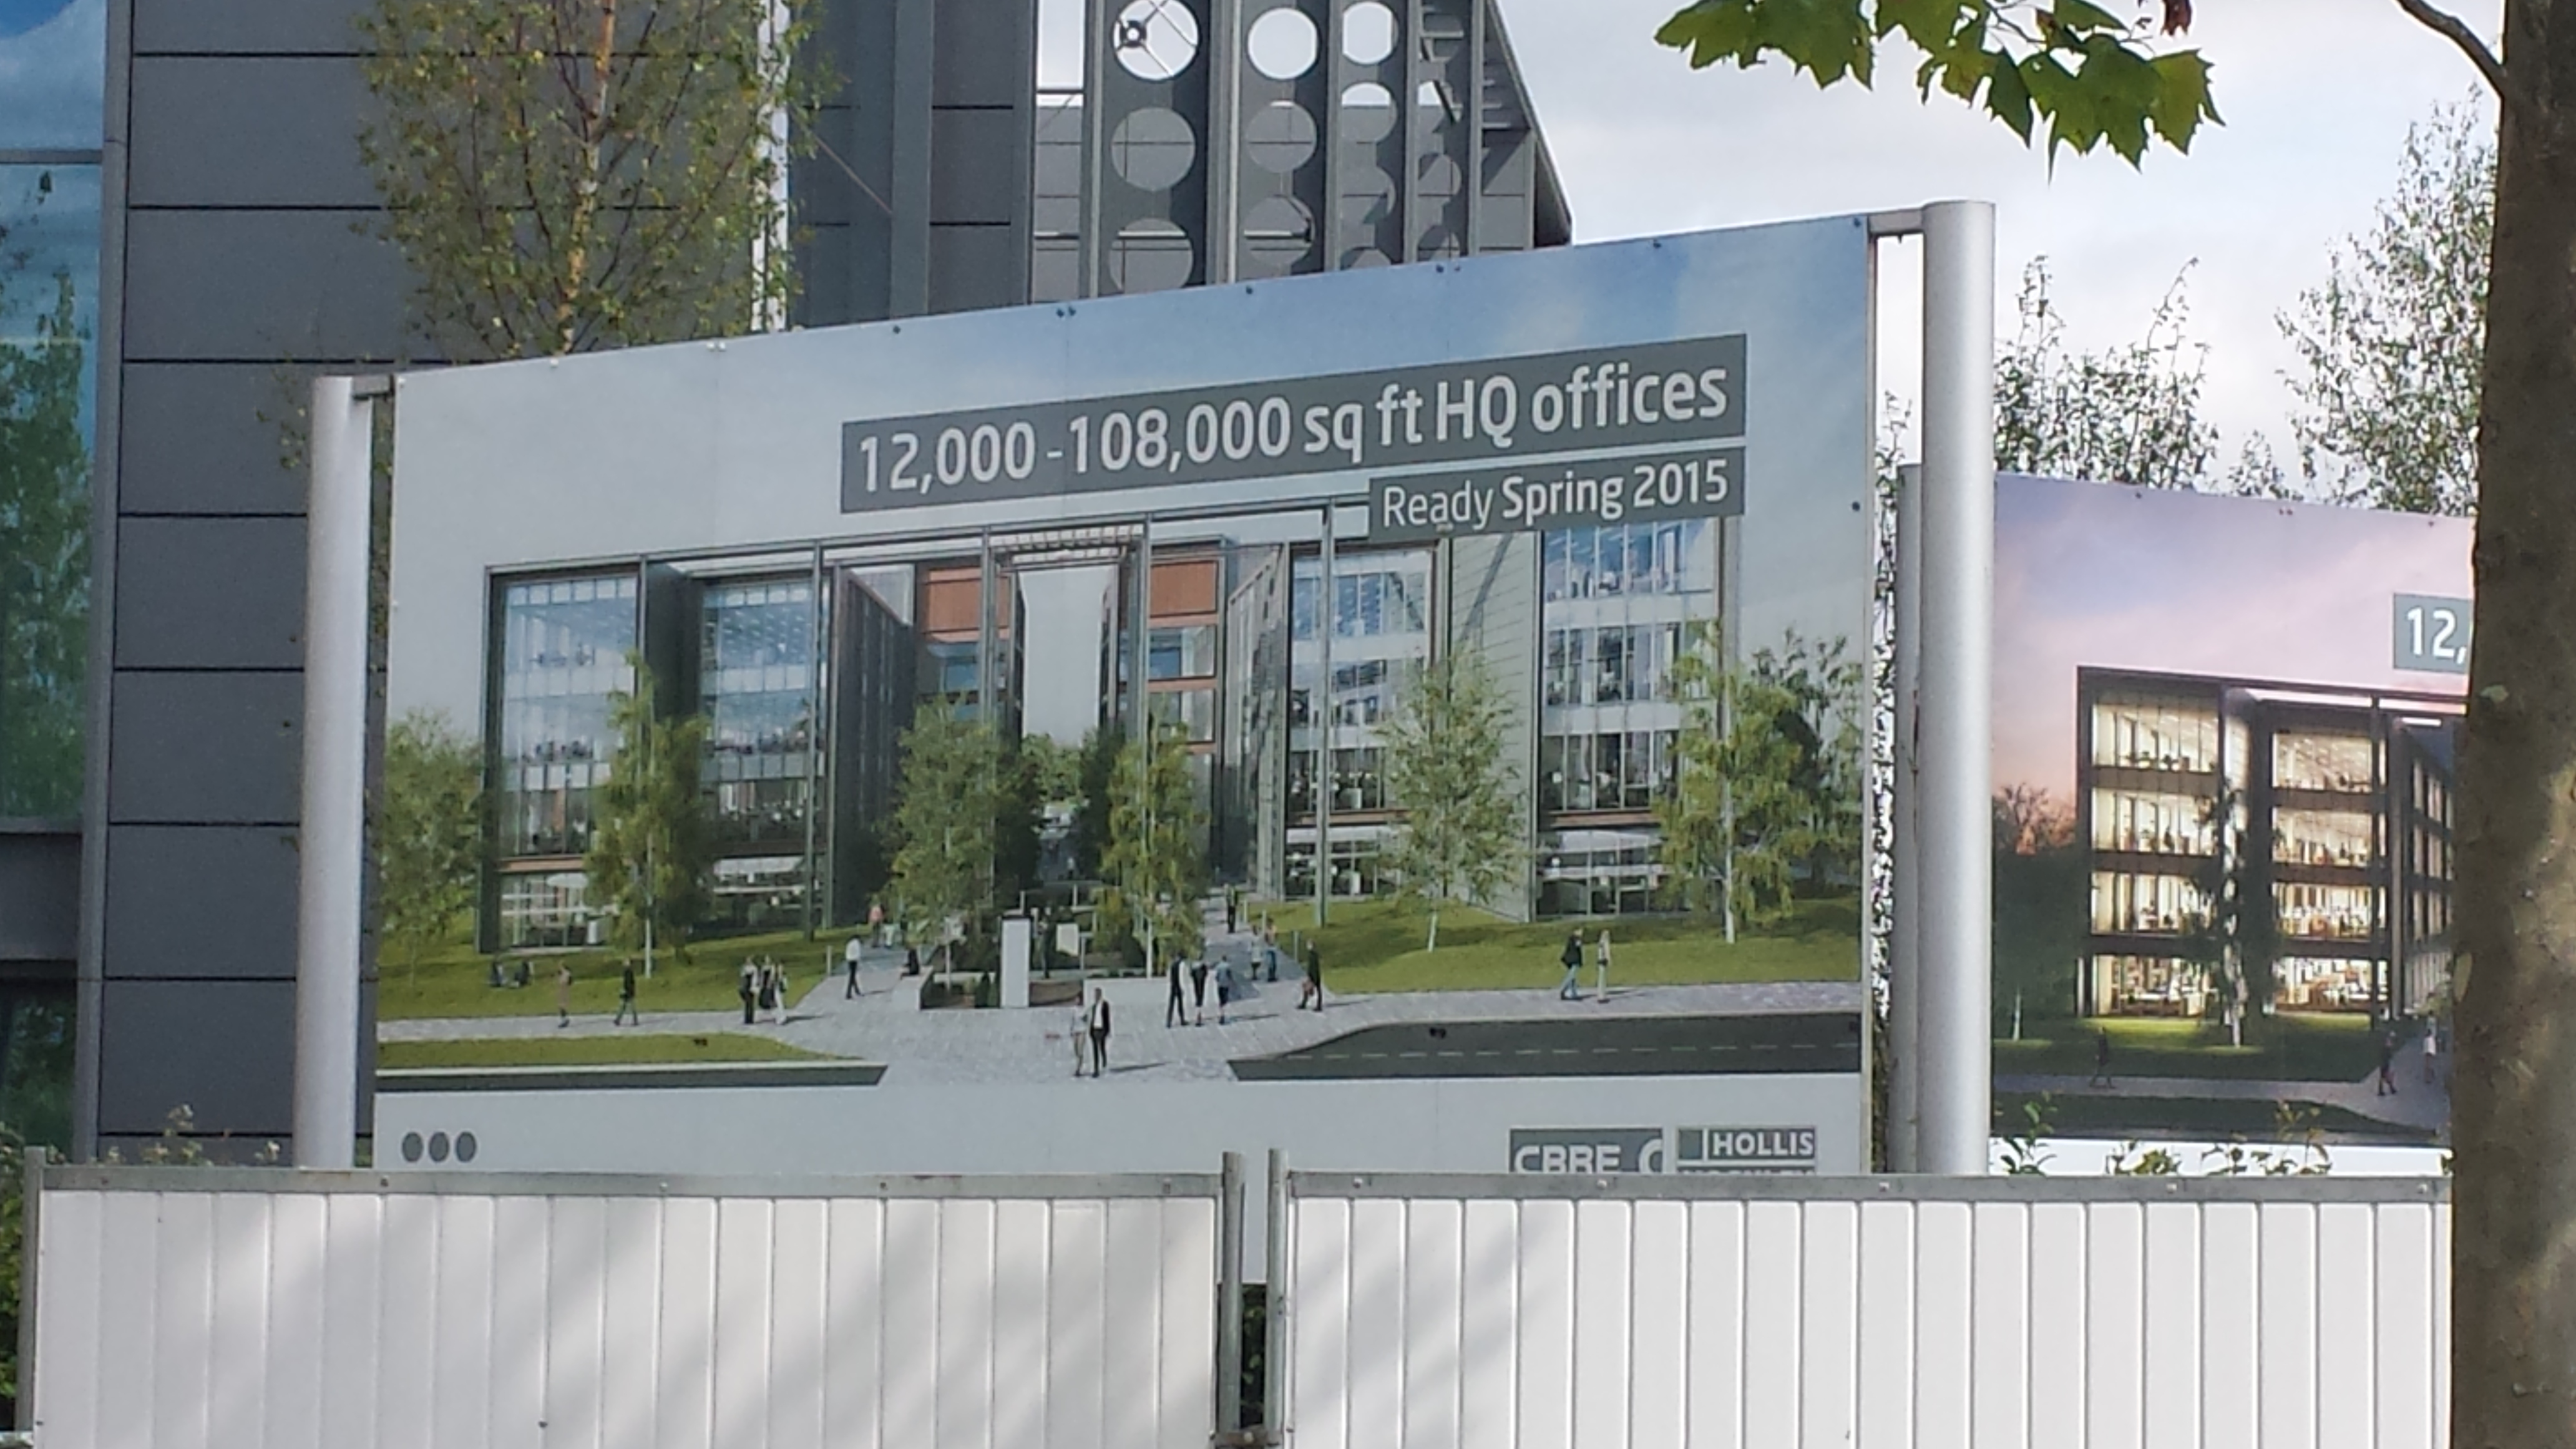
Finally, despite enjoying high levels of employment, it is clear that we need to change the way we forecast jobs growth in the area as past methods have resulted in vast amounts of unused employment land and vacant retail outlets with examples illustrated here and here.

It is clear that past employment forecasts have been erroneous; that the future employment forecasts in the SHMA are spurious and do not represent a realistic assessment of future economic or employment growth rates; and the local communities have not been consulted upon this key issue.  Nevertheless, we can achieve enviable growth and employment rates in line with the requirement to “plan positively” without having to resort to such over-development.

Accordingly, the 5,100 additional houses in the SHMA related to the flawed employment forecasts should be removed.

Overall adjustments lead to building rate higher than national requirement

Hart Surrey Heath and Rushmoor SHMA adjustments applied at national level

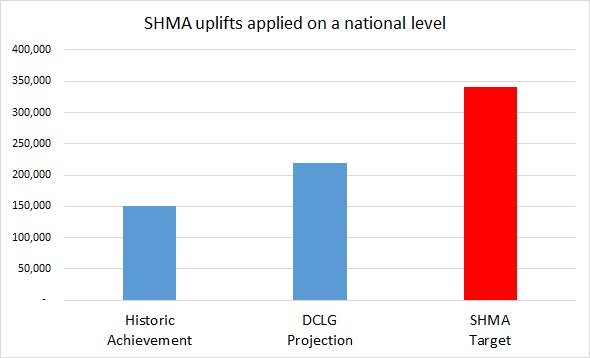
Figure 5: Hart Surrey Heath and Rushmoor SHMA adjustments applied at national level

Evidence presented at the examination of the Vale of the White Horse Local Plan has demonstrated that if the adjustments made to the baseline DCLG housing projections were applied on a national basis, they would increase the national output of housing to double the DCLG estimate of what is needed and triple the recent output of housing.

Applying a similar approach to the Hart, Rushmoor and Surrey Heath SHMA shows that on a national basis, we would be delivering 54% more housing than we need on a national basis, see Figure 5 above.  Surely it cannot be right that we are being asked to build at a rate that would lead to a surplus of housing.

England housing delivery actuals and projected 1946-2031

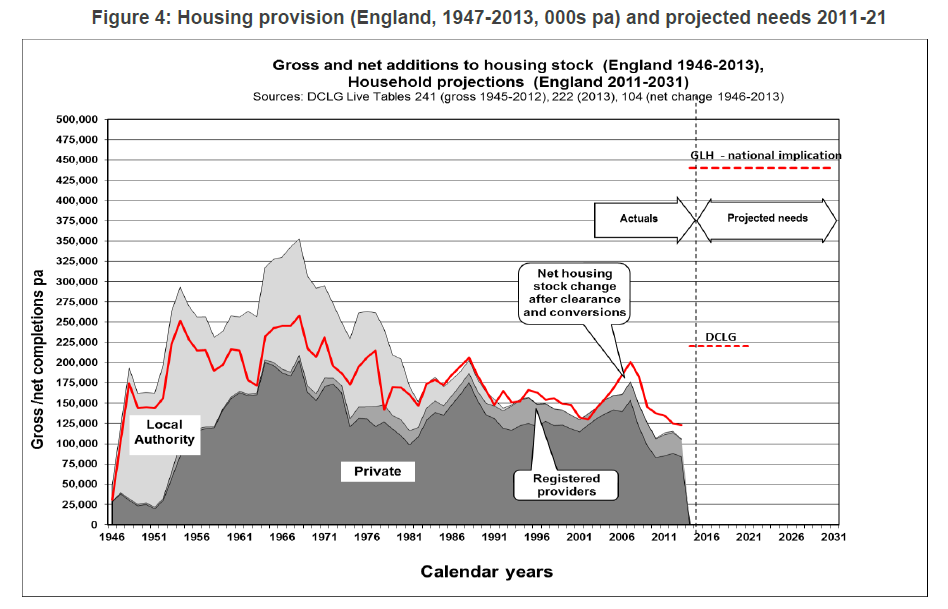
Figure 6: England housing delivery actuals and projected 1946-2031

The baseline DCLG projections for the combination of Hart, Surrey Heath and Rushmoor call for 790 houses per annum (SHMA Figure 7.3).  This equates to the DCLG projection of 220,000 houses per annum nationally (see figure 6 above).  This compares to recent performance of around 150,000 houses per annum.

The final SHMA, after taking into account past under-delivery, amount to a total of 24,413 houses (see table below), or an increase of 54.6% over the DCLG baseline figures.  The duty to cooperate might mean that Hart District has to build more houses than either Surrey Heath or Rushmoor as part of our Local Plan.

Hart DistrictSurrey Heath BoroughRushmoor BoroughTotal Housing Market Area
Original SHMA7,5347,0579,82224,413
Proposed Transfers3,022(1,400)(1,622)0
New Total10,5565,6578,20024,413

If the same 54.6% uplift were applied to the DCLG projection, we would be building over 340,000 houses per annum nationally, more than double recent performance.

In recent years Hart has built more houses than it has been required to do and built at a rate above regional and national averages (SHMA Table 5.11).  It is beginning to look like the total of the local SHMAs are much larger than the overall requirement as defined by the DCLG. Surely it cannot be right that we are being asked to build at rate more than 50% higher than the DCLG suggests we need to meet overall demand.

Conclusions

The overall impact of removing these errors would be to reduce the overall housing target for the combined area by around 7,800 units.  This would reduce Hart’s overall housing target to around 6,100 units and crucially reduce Rushmoor and Surrey Heath’s target so they don’t need to ask Hart to build 3,100 houses for them.  This will mean that Hart will be able to satisfy the rest of its target from brownfield development alone.

The brownfield development tracker

Brownfield Development thermometer for Hart District

Given the recent success in quantifying the brownfield development potential in Hart District, we thought it would be good to set up a monitor to see how close we are to identifying all of the dwellings we need to meet the residual requirement of 4,000 units for the Hart Local Plan.

This of course assumes that we have to deliver the Objectively Assessed Housing Need (OAHN) in the Strategic Housing Market Assessment (SHMA).  There is a chance we might have to deliver an extra 3,100 houses for Surrey Heath and Rushmoor.  But equally there is also the potential for us to challenge the SHMA and end up with a lower housing target.

We will try and keep track of this as the process develops.

We Heart Hart Presentation to Crondall Parish Council

We Heart Hart were delighted to be invited to speak at tonight’s parish council meeting at Crondall.


The presentation went well with lots of interest in the Hart Local Plan and how we might persuade Hart Council to think again, particularly to focus on brownfield development and fight off the demand for us to build 3,100 extra houses for Surrey Heath and Rushmoor Borough Councils.  Lots of interest in our leaflet too.


A copy of the presentation and leaflet are available for download below.


We Heart Hart Presentation to Crondall Parish Council


We Heart Hart Campaign Flyer


Presentation