Hart District is being asked to build too many houses

Housing Market Area Migration and housing capacity

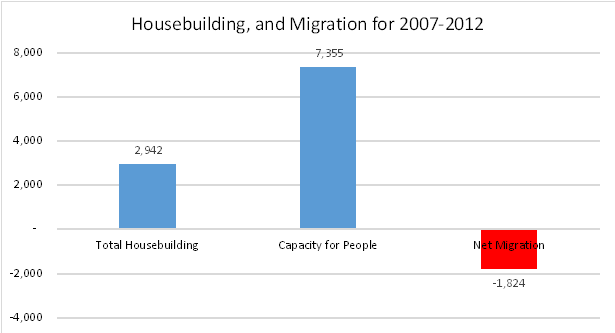
Figure 1: Housing Market Area Migration and housing capacity

Hart District is being asked to build 7,534 houses in the planning period up to 2032 (now 9,134 as Hart is starting to plan for an additional 1,600 houses from Rushmoor).  This target is based on the Objectively Assessed Housing Need (OAHN) contained in the Strategic Housing Market Assessment (SHMA) carried out by Hart District and Rushmoor and Surrey Heath Boroughs. We believe this target is too high because the SHMA is based on a number of flawed assumptions:

  • Inward migration assumptions unrealistic
  • Average household size unreasonable
  • Jobs growth forecasts not credible
  • Overall adjustments lead to building rate higher than national requirement

These are set out in more detail below and in the submission to the Owens Farm (Hop Garden Road), Hook appeal. The overall impact of correcting these errors would be to reduce Hart District’s overall housing target to around 6,100 units and crucially reduce Rushmoor and Surrey Heath’s target so they don’t need to ask Hart to build 3,100 houses for them.  This will mean that Hart will be able to satisfy the rest of its target from brownfield development alone and won’t need a new town at Winchfield or anywhere else.

Inward Migration Assumptions Unrealistic

Inward migration to this or any other district represents a “want” of people living elsewhere to live in Hart and not a “need”.  Many people may desire to live in Hart because it is one of the best places to live in the country, but no-one “needs” to move to live here in the strict sense of the word.  Indeed inward migration to Hart represents the unmet needs of other districts.  If Government policy is followed, then the housing, employment, education and other “needs” of the people “wanting” to move to Hart should be met by the local authorities where they currently live and thus the apparent need for housing in Hart arising from inward migration should substantially reduce.  There is no evidence presented in the SHMA to evaluate the impact of reduced inward migration to Hart from other districts as a result of those districts now being forced to meet their own needs, nor the impact of the implementation of the Northern Powerhouse.  Indeed London has now agreed to meet its own housing need in full, which should reduce the scale of inward migration to the HMA.

Notwithstanding the above, the SHMA makes a subjective judgement to cherry pick inward migration data from 2005-2010 as being the “most realistic” approach to take to future demographic modelling.  Moreover, it uses spurious statistical analysis to try to infer causation from a weak correlation (R2=~0.65) between housing completions and inward migration.  This is inherently flawed for a number of reasons outlined below.

First, of course it is self-evident that the period during which the HMA delivered most housing was when inward migration was highest.  However, as was argued above, this scale of inward migration represents unmet needs of other districts rather than the unmet needs of Hart.

Second, the period when we were building most and attracting most inward migration was during one of the longest uninterrupted periods of economic growth in history, supported by a large structural deficit in the national accounts and the biggest credit binge of all time.  Of course it ended in a spectacular bust and can in no way be described as a “normal” or “sustainable” set of economic conditions.  The economic conditions we are seeing now with more moderate growth linked to the need for the Government, companies and people to live within their means and reduce debt will be the situation for the foreseeable future and thus represent a more “normal” situation.

The period 2007-2012 includes the final year of the boom, the recession and the now more moderate pace of economic growth that surely more closely represents future conditions.  Indeed, as Figure 1 shows (data taken from Fig. 7.4 of the SHMA on p71) taking the period 2007-2012, the HMA delivered 2,942 new dwellings which at an average of 2.5 people per dwelling created capacity for an extra 7,355 people to live in the area.  Despite that, the HMA experienced an overall outward migration of 1,824 people.  It surely cannot be considered sound to base the future housing “need” on increasing inward migration projections when recent data shows that in fact the HMA is undergoing net outward migration despite creating significant capacity for more people to live here.

Accordingly, the additional 1,210 houses postulated in the SHMA arising from inward migration should be removed from the housing “need”.

Average Household Size Forecasts Unreasonable

Average Houshold Size projections for Housing Market Area

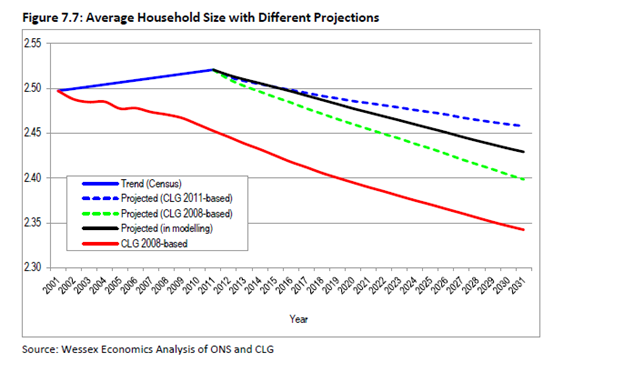
Figure 2: Average Household Size projections for Housing Market Area


Figure 7.7 of the SHMA (reproduced as Figure 2 above) shows that the trend in household size as measured by the census is slightly upward for the period from 2001 to 2011. This is in direct contradiction to both the 2008-based and 2011-based CLG projections.  Yet the forward projections used in the SHMA reverse the trend shown in actual data in the census and persist with the inaccurate forecasts of a continuing fall in the average household size.

Part of the justification for this is given as “at the time of the 2011 Census, the British economy was still in recession”.  This is factually incorrect as a cursory examination of the GDP numbers on the BBC website shows that the economy came out of recession in mid-2009.  It seems the forecasting “experts” are at a loss to properly explain this reversal of trend.

Moreover, given that the starting point for the SHMA projections is DCLG sourced figures, it would be somewhat odd for the DCLG forward projections not to include its own forecasts for household size.  There is therefore a significant risk that this part of the SHMA has double counted erroneous household size projections.

It is therefore inappropriate continue to assume a continuing downward trend in household size.  Surely a more prudent assumption would be to assume that the current household size is maintained and update that assumption and the SHMA as more real data comes to light.

Accordingly, the 1,500 additional houses in the SHMA related to the flawed household size assumption should be removed.

Jobs Growth Forecasts not Credible

The SHMA uses a set of jobs growth assumptions that are based on forecasts that are vastly in excess of what has been achieved in the most recent economic cycle.

The SHMA contains data on the historic rates of job growth for the HMA.  This shows two sets of data that are derived from different sources and cover different time periods (Figures 4.3 & 4.4 of the SHMA).

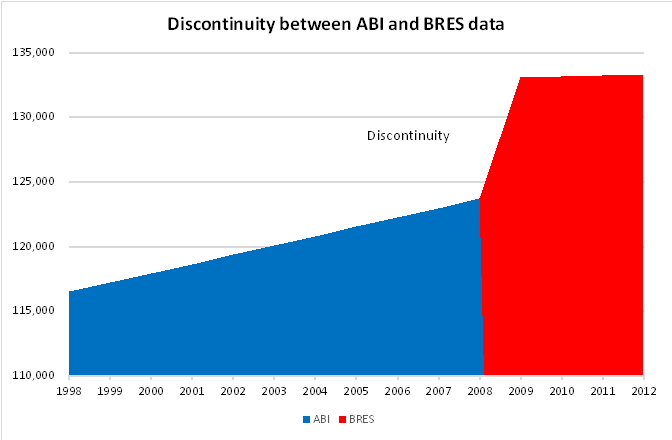
First, there is the period 1998-2008, covered by ABI data.  This shows overall job growth in the period of 7,200, or 720 per annum for the 10 year period with a compound annual growth rate (CAGR) of 0.6%.  Second there are different BRES sourced data for the periods of 2009-2012. The BRES data from 2009-2012 shows total jobs growth of 200, or 67 per annum for the 3 years in question or a CAGR of 0.05%.

Discontinuity between ABI and BRES jobs data for Housing Market Area

Figure 3: Discontinuity between ABI and BRES jobs data for Housing Market Area

Figure 3 shows a comparison of the BRES data and the ABI data that demonstrates the discontinuity between 2008 and 2009, with a jobs increase of nearly 10,000 when we know the economy was in the teeth of a deep recession. Note that the report states that the ABI and BRES data cannot be directly compared because they are compiled using different methods. It is therefore clear that each period (and dataset) should be treated separately and independently rather than splicing them together.

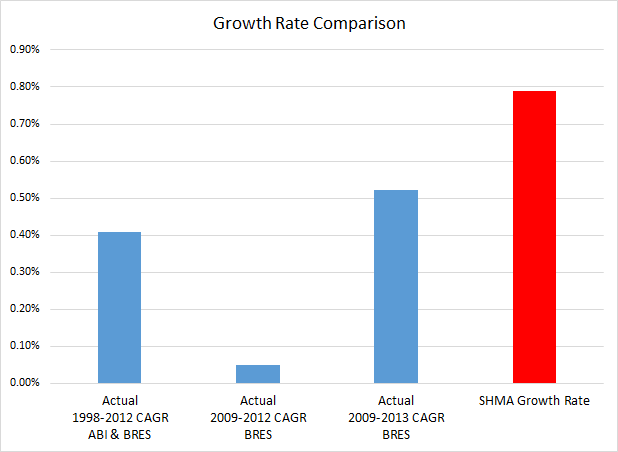
Treating the datasets separately would indicate total jobs growth over the economic cycle of 7,400, or 529 per annum or a CAGR of 0.41%, based on backward extrapolation of the BRES data.

Taking this 0.41% rate of growth as a future projection would mean we would add 11,332 overall jobs over the period of 2012-2032 at an average rate of 567 total jobs per annum.

However, the SHMA uses as its central assumption that future jobs growth of 1,130 per annum will be achieved, equating to a CAGR of ~0.79%, nearly double what was achieved over the most recent economic cycle and far higher than that achieved during the unsustainable boom of 1998-2008.  Given the constraints on Government spending and tighter credit conditions that are likely to persist for some time due to tighter bank regulation, it is inconceivable that we will achieve an economic growth rate nearly twice that achieved during the last economic cycle. Figure 4 shows the comparison of these growth rates.

Hart Surrey Heath and Rushmoor Jobs Growth rates 1998 to 2013 compared to SHMA

Figure 4: Hart Surrey Heath and Rushmoor Jobs Growth rates 1998 to 2013 compared to SHMA

Little justification for this is given other than it is based on Experian forecasts. The recent job creation history (2009-2012) showed jobs growth of 67 per annum as we came out of the recession.  67 jobs per annum equates to less than 6% of the jobs that the SHMA assumes we will create. Revised figures for 2013 demonstrate a CAGR of jobs growth from 2009-2013 at 0.52%, still well below the SHMA projections at a time the UK as a whole is creating more jobs than the rest of the EU put together.  This demonstrates that the Experian forecasts are pie in the sky and it beggars belief that such unproven Experian forecasts should take precedence over the actual real world achievement.

A further illustration of the outlandish nature of the Experian forecasts is given in para 7.70 of the SHMA.  In its forecast published in 2013, Experian assumes there were 145,000 jobs in the HMA in 2011.  Whereas the 2011 Census says there were only 122,300 and the BRES data says 125,000.  How can we trust Experian to forecast the future when it can’t even get the the past right?

Even the Employment Land Review produced by Rushmoor Borough Council described the Experian forecasts as:

“Experian-derived forecasts which are considered unreliably high in that they make too many assumptions around unconstrained economic growth”

The SHMA also says at para 7.85:

“…there are many ways labour markets can adjust to an increase in demand for labour that do not require an increase in the resident workforce. In summary these are:

  • A reduction in unemployment
  • A rise in economic activity rates
  • A shift away from part time working to full time working
  • An increase in double jobbing
  • A reduction in out-commuting
  • An increase in in-commuting

None of these changes require an increase in resident population, and all of them will be stimulated if
wage and salary levels increase.

In the modelling, allowance has been made for only one of these effects…”

No explanation is given for not taking into account the other ways in which the labour market can adjust.

In addition, if one compares the jobs forecasts to the population forecasts, the overall forecasts imply a massive, unrealistic increase in the percentage of people of working age in employment as can be seen in the table below:


Data Point2011 (Census)2011 (BRES)2031 (PROJ 2)2031 (PROJ 5)
SHMA Population (a) 272,394 272,394 307,578 322,278
People in employment (b) 122,300 125,000 162,233 170,223
Overall % in employment (b/a)44.9%45.9%52.7%52.8%
People over 70 (c) 28,559 28,559 51,164 51,164
People 5-19 (d) 67,375 67,375 73,206 73,206
People of working age (a-c-d)=e 176,460 176,460 183,208 197,908
% working age in employment (b/e)69.3%70.8%88.6%86.0%

This shows an increase from around 70% of working age people in employment to 86-88%.  No justification for this increase is given anywhere.

From the above, it is clear that the employment forecasts are outlandishly large and the SHMA does not even take into account most of the ways in which jobs can increase without leading to a need for more housing.  It is clear we should not be basing our housing requirement on such forecasts.

Figure 4.1 of the SHMA demonstrates that Hart in particular and the whole HMA enjoy high levels of employment and unemployment levels that are below the regional and national averages.

Therefore, the number of jobs to be created in the future should at least partially be a matter of “want” rather than “need”.  The future employment targets should be based on a realistic assessment of the capacity of the economy to create jobs in the private sector as it is these jobs that will support the largely state sector jobs in education and health that will be required to support the increased population.

As noted above para 7 of the NPPG states that local communities should be involved

“from the earliest stages of plan preparation, which includes the preparation of the evidence base in relation to development needs”.

Moreover, a recent legal opinion from Peter Village QC has said:

“There has been no regulation 18 consultation at all on issues such as employment, retail, transport, infrastructure (or, indeed, anything other than housing distribution). It is inconceivable that a coherent and sound local plan could emerge without addressing most (at least) of these issues.”

It therefore follows that the local community should be consulted upon the employment targets it wishes to set and the related scale of development required to meet that target.  No such consultation has taken place, nor is it planned which represents a significant flaw in the Local Plan process. The evidence from the petition indicates that local people are more likely to express a preference for a lower level of development.

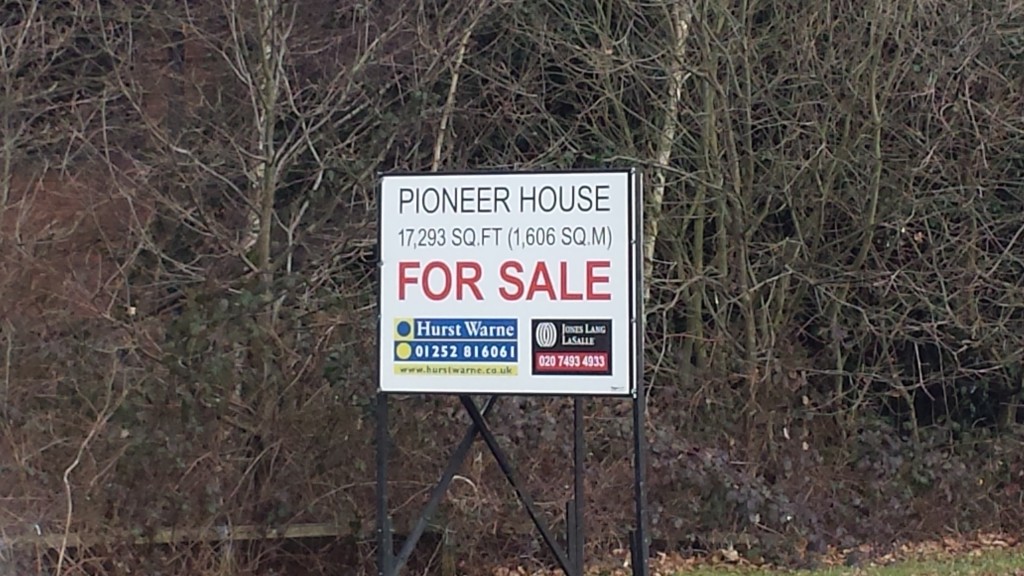
Finally, despite enjoying high levels of employment, it is clear that we need to change the way we forecast jobs growth in the area as past methods have resulted in vast amounts of unused employment land and vacant retail outlets with examples illustrated here and here.

It is clear that past employment forecasts have been erroneous; that the future employment forecasts in the SHMA are spurious and do not represent a realistic assessment of future economic or employment growth rates; and the local communities have not been consulted upon this key issue.  Nevertheless, we can achieve enviable growth and employment rates in line with the requirement to “plan positively” without having to resort to such over-development.

Accordingly, the 5,100 additional houses in the SHMA related to the flawed employment forecasts should be removed.

Overall adjustments lead to building rate higher than national requirement

Hart Surrey Heath and Rushmoor SHMA adjustments applied at national level

Figure 5: Hart Surrey Heath and Rushmoor SHMA adjustments applied at national level

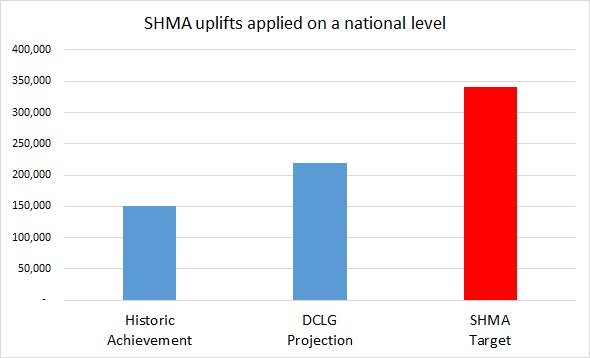
Evidence presented at the examination of the Vale of the White Horse Local Plan has demonstrated that if the adjustments made to the baseline DCLG housing projections were applied on a national basis, they would increase the national output of housing to double the DCLG estimate of what is needed and triple the recent output of housing.

Applying a similar approach to the Hart, Rushmoor and Surrey Heath SHMA shows that on a national basis, we would be delivering 54% more housing than we need on a national basis, see Figure 5 above.  Surely it cannot be right that we are being asked to build at a rate that would lead to a surplus of housing.

England housing delivery actuals and projected 1946-2031

Figure 6: England housing delivery actuals and projected 1946-2031

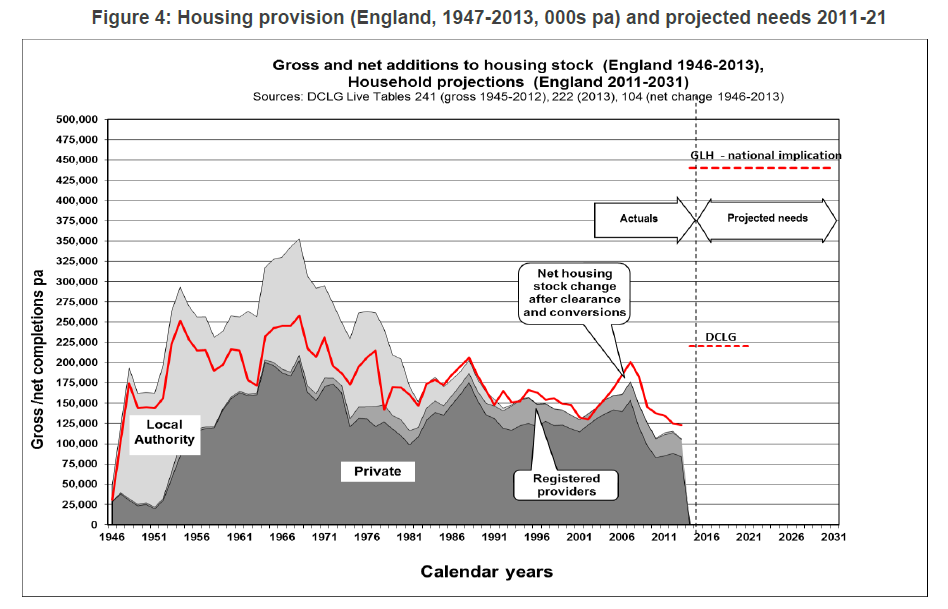
The baseline DCLG projections for the combination of Hart, Surrey Heath and Rushmoor call for 790 houses per annum (SHMA Figure 7.3).  This equates to the DCLG projection of 220,000 houses per annum nationally (see figure 6 above).  This compares to recent performance of around 150,000 houses per annum.

The final SHMA, after taking into account past under-delivery, amount to a total of 24,413 houses (see table below), or an increase of 54.6% over the DCLG baseline figures.  The duty to cooperate might mean that Hart District has to build more houses than either Surrey Heath or Rushmoor as part of our Local Plan.

Hart DistrictSurrey Heath BoroughRushmoor BoroughTotal Housing Market Area
Original SHMA7,5347,0579,82224,413
Proposed Transfers3,022(1,400)(1,622)0
New Total10,5565,6578,20024,413

If the same 54.6% uplift were applied to the DCLG projection, we would be building over 340,000 houses per annum nationally, more than double recent performance.

In recent years Hart has built more houses than it has been required to do and built at a rate above regional and national averages (SHMA Table 5.11).  It is beginning to look like the total of the local SHMAs are much larger than the overall requirement as defined by the DCLG. Surely it cannot be right that we are being asked to build at rate more than 50% higher than the DCLG suggests we need to meet overall demand.

Conclusions

The overall impact of removing these errors would be to reduce the overall housing target for the combined area by around 7,800 units.  This would reduce Hart’s overall housing target to around 6,100 units and crucially reduce Rushmoor and Surrey Heath’s target so they don’t need to ask Hart to build 3,100 houses for them.  This will mean that Hart will be able to satisfy the rest of its target from brownfield development alone.
The brownfield development tracker

Brownfield Development thermometer for Hart District

Given the recent success in quantifying the brownfield development potential in Hart District, we thought it would be good to set up a monitor to see how close we are to identifying all of the dwellings we need to meet the residual requirement of 4,000 units for the Hart Local Plan.

This of course assumes that we have to deliver the Objectively Assessed Housing Need (OAHN) in the Strategic Housing Market Assessment (SHMA).  There is a chance we might have to deliver an extra 3,100 houses for Surrey Heath and Rushmoor.  But equally there is also the potential for us to challenge the SHMA and end up with a lower housing target.

We will try and keep track of this as the process develops.

Brownfield Capacity in Fleet and Hook Keeps on Rising

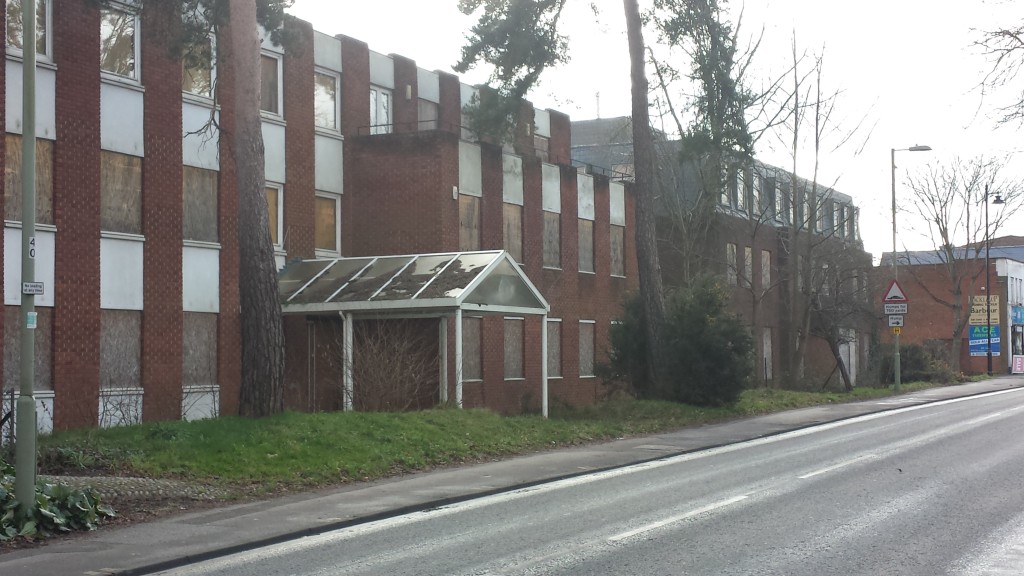
Derelict Offices in Fleet, Hampshire

Derelict Offices in Fleet, Hampshire

Back in November Hart Council insisted (p15) that the brownfield capacity for the district over the next 20 years was around 700-750 dwellings.  However, a number of recent developments show that this is assumption is incorrect and the available capacity is much larger and we could meet all of our remaining housing allocation through brownfield development alone.


LocationNumber of Dwellings
Guillemont Park Phase 1 (not included as brownfield site in SHLAA) 150
Guillemont Park Phase 2320
Ancells Farm, Fleet370
Bartley Wood, Hook200
Fleet Road, Fleet220
Bramshill House350
Fleet Police Station50
Extra dwellings at Landata House28
Total1,688


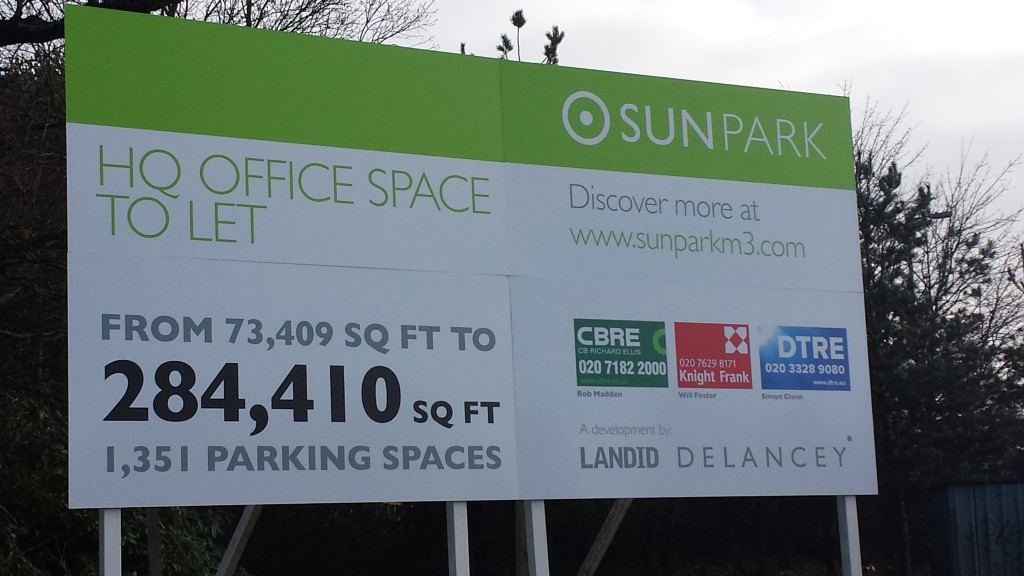
First, planning permission has recently been granted for 150 dwellings at Guillemont Park (former Sun Park site), an increase of 48 over the SHLAA estimate, near the J4a of the M3.  In addition, a developer has submitted a preliminary application for a further 320 houses on the same site, bringing the total up to 470 dwellings on just one site.

In addition, Stonegate Homes Limited have produced a report on on the potential capacity for converting offices to residential under permitted development rights in Fleet and Hook.  They have come to the conclusion that there’s an extra 790 units that could be delivered quite easily, with further additional capacity available at Ancells Farm.

Furthermore, discussions are underway to deliver about 350 new homes at the former Police College site at Bramshill House.

This brings a total of 1,610 of new brownfield capacity identified since November 2014, more than double Hart’s assessment of the capacity for the 20-year planning period. Notably, none of the 1,610 units above are on sites designated as brownfield in the SHLAA of October 2014, so all of these units are incremental to their original 750 estimate, bringing the current total up to 2,360.  We have started a tracker to monitor future progress.

Update: Fleet police station has now become available creating a new brownfield site for perhaps 50 apartments and Landata House has a planning application in place to increase the units by 28, bringing the total up to 2,438 units.

We have already shown that Hart has also under-estimated the available capacity on the sites it has identified because it has used a very conservative density assumption of only 30 dwellings per hectare (dph), whilst separately admitting it could go to 80-160dph in urban areas.  This would push its own estimate of 700-750 to 2,800-3,000 units meaning the total residual requirement of 4,000 units is within grasp.

Taken together, the sites in the table above and the potential increase in capacity from the sites Hart originally counted, then the full remaining housing allocation could be met in full on brownfield sites.

There is still no sign that Hart is taking brownfield development seriously enough, so if you would like to join our campaign to change the approach and adopt our 5-point plan, then please sign and share our petition:


Go to Petition


Revised submission to Owens Farm (Hop Garden Road) Appeal

The slot we thought we had been allocated to the first part of the Hop Garden Road (Owens Farm), Hook  appeal (APP/N1730/W/14/2226609) unfortunately didn’t happen due to some administrative hiccough.  However, we have now been allocated a slot at 10am on 9 June 2015.  This has presented an opportunity to improve further our submission and make it stronger.

The full details of the submission can be found here:

Revised submission to Hop Garden Road Appeal

The summary of the submission is presented below and the main challenge to the SHMA here:

This purpose of this submission by the We Hart Campaign is to oppose the specific unnecessary development proposed at Hop Garden Road in Hook and demonstrate to other developers who may wish to put forward speculative proposals for the over-development of the district that they will face formidable opposition to their plans.  Hart District is facing a scale of development that is against the wishes of its residents and in contradiction to stated Government policy to place planning decisions in the hands of local people.

Let me remind you of the Prime Minister’s words in 2012, taken from this Telegraph article:

He said: “I care deeply about our countryside and environment. Our vision is one where we give communities much more say, much more control. The fear people have in villages is the great big housing estate being plonked down from above.

“Our reforms will make it easier for communities to say ‘we are not going to have big plonking housing estate landing next to the village, but we would like 10, 20, 30 extra houses and we would like them built in this way, to be built for local people’.”

Mr Cameron, who was being interviewed in his Oxfordshire constituency, denied that the reforms would lead to large swathes of the countryside being built on.

He told BBC1’s Countryfile programme: “Here we are in west Oxfordshire one of the most beautiful parts of our country, set in some of England’s finest countryside. I would no more put that at risk than I would put at risk my own family.

“I care deeply about our countryside and environment. Our vision is one where we give communities much more say, much more control.”

We Hart object to this proposed development and any future speculative proposals on the grounds summarised below:

  • The SHMA and OAN are not objective and represent a “need” that is far too high.
  • Understated brownfield capacity means green field development is not necessary
  • This proposed development will not contribute towards meeting the needs of the changing demographics of the district
  • The proposed development will make the current infrastructure funding gap worse
  • Lack of consideration of the environment

As shown in section 8, the combined effects of reducing the OAN as assessed in the SHMA to a more realistic level and taking account of brownfield development in the pipeline that is not included in the Land Supply calculation would increase the land supply to 11.7 years.

The only reasonable conclusion from this analysis is that the Hop Garden Road application should be refused as it is not required; would build the wrong type of housing in the wrong place to meet the changing demographics of the district; would make the already difficult infrastructure funding position worse and needlessly concrete over our valuable green fields and damage the environment.

We Hart respectfully requests that this application is turned down.


Link

What legacy do Winchfield landowners want to leave for future generations?

Cows in Winchfield, Hart District, Hampshire

Cows in Winchfield

Robert Worsley has made the news recently by famously turning down an offer of £275m for his land in Sussex, saying:

‘What would I be doing to my neighbours and the other farmers round here? I could not be held responsible for putting the area under concrete.’

His principled stand to protect the legacy he leaves behind for future generations has won admiration across the country.

Andrew Renshaw, one of the landowners in Winchfield took a stand against development even before Robert Worsley, by expressing his strong opposition to a new town and he put up signs saying his part of Winchfield is not for sale.

Might it be possible to persuade the other landowners in Winchfield to think about the legacy they might be leaving for future generations and turn down the offers from the voracious developers?  That might force a much stronger focus on brownfield development and a more common sense approach to Hart Council’s Local Plan.


Hart District Council under-estimates brownfield capacity again

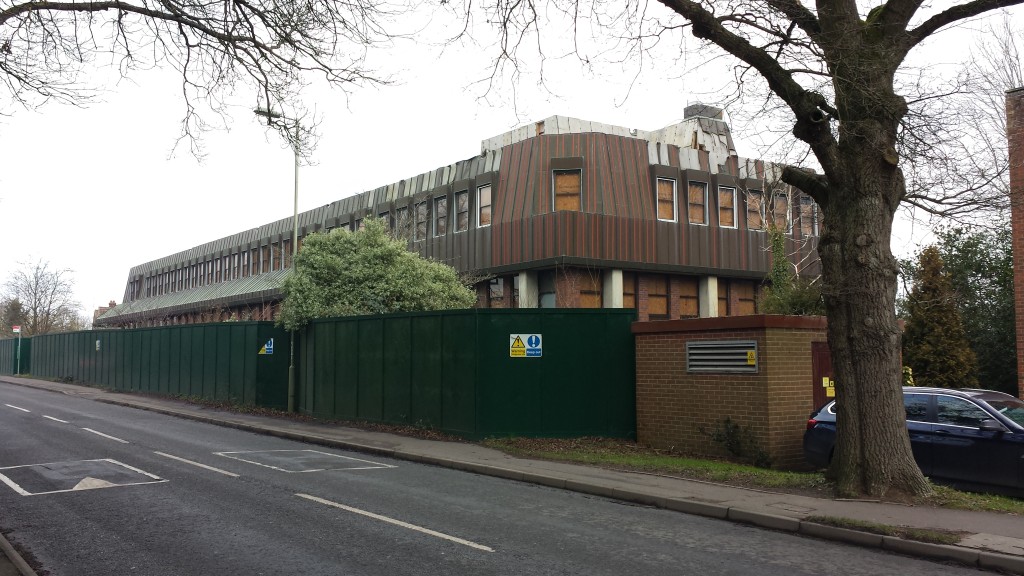
Vacant Sun Park (Guillemont Park) block near J4A of M3, Cove, Hart District, Hampshire

Vacant Sun Park (Guillemont Park) block near J4A of M3, Cove, Hart District, Hampshire

A preliminary application has been made to build 350 dwellings at the old Sun Park (Guillemont Park) site, near J4A of the M3, Fleet, in addition to the earlier application for a further 120 homes on another part of the site.  Provided concerns over road access can be overcome, this looks like a valuable addition to our brownfield capacity.

On the face of it, this is good news but further illustrates how misleading Hart District Council’s figures about brownfield capacity were when the council voted for plans to test a new town at Winchfield back in November 2014. Back then, they estimated overall brownfield capacity at only 700 units.

However, even though this site (SHL152) was in their assessment of Land Availability (SHLAA), it underestimated capacity (300 dwellings compared to the total now at 470), and wasn’t counted as a brownfield site as it was included in their “Adjacent to settlement boundaries” section.

If Hart Council are serious about a “brownfield first” strategy, surely they must now create a proper register of potential sites and properly assess the capacity and feasibility of delivering our residual requirement on brownfield only sites.

If you are worried about Hart’s hopeless position on the Local Plan and like our 5-point plan to bring it back on track and add to the pressure to Hart to adopt a brownfield strategy and drop all ideas of a new town, the please sign and share our petition:


Go to Petition


We Heart Hart submits objection to Hop Garden Road development in Hook

We Heart Hart has submitted an objection to the Hop Garden Road (Owens Farm) development in Hook.

The full details of the submission can be found here:

Submission to oppose development of Hop Garden Road

The summary of the submission is presented below:

The purpose of this submission by the We Hart Campaign is to oppose the specific unnecessary development proposed at Hop Garden Road in Hook and demonstrate to other developers who may wish to put forward speculative proposals for the over-development of the district that they will face formidable opposition to their plans.  Hart District is facing a scale of development that is against the wishes of its residents and in contradiction to stated Government policy to place planning decisions in the hands of local people.

Let me remind you of the Prime Minister’s words in 2012, taken from this Telegraph article:

http://www.telegraph.co.uk/earth/hands-off-our-land/9002655/Hands-Off-Our-Land-Housing-estates-will-not-be-plonked-next-to-villages-pledges-David-Cameron.html

He said: “I care deeply about our countryside and environment. Our vision is one where we give communities much more say, much more control. The fear people have in villages is the great big housing estate being plonked down from above.

“Our reforms will make it easier for communities to say ‘we are not going to have big plonking housing estate landing next to the village, but we would like 10, 20, 30 extra houses and we would like them built in this way, to be built for local people’.”

Mr Cameron, who was being interviewed in his Oxfordshire constituency, denied that the reforms would lead to large swathes of the countryside being built on.

He told BBC1’s Countryfile programme: “Here we are in west Oxfordshire one of the most beautiful parts of our country, set in some of England’s finest countryside. I would no more put that at risk than I would put at risk my own family.

“I care deeply about our countryside and environment. Our vision is one where we give communities much more say, much more control.”

We Hart object to this proposed development and any future speculative proposals on the grounds summarised below:

  • The SHMA and OAN are not objective and represent a “need” that is far too high.
  • Understated brownfield capacity means green field development is not necessary
  • This proposed development will not contribute towards meeting the needs of the changing demographics of the district
  • The proposed development will make the current infrastructure funding gap worse
  • Lack of consideration of the environment

You can help by going along to the appeal, to be held between Tuesday 12th May and Thursday 14th May, 10am to 5pm.  The first day starts at 10am and probably through to 5pm at Hart Council’s Civic Offices, Harlington Way, GU51 4AE, Fleet.  More details here.

link

Hart Council rules out register of brownfield sites

Vacant, derelict brownfield site in Hook, Hampshire

Vacant, derelict block in Hook, Hampshire

In a worrying development at the Hart Council meeting on Thursday 30th April, the leader of the council, Stephen Parker, ruled out creating a register of brownfield sites in the district, whilst at the same time insisting that the council supported a “brownfield first” strategy.

He said that the Strategic Housing Land Availability Assessment (SHLAA) had identified only 750 dwellings as being “deliverable” within the time-scale of the Local Plan.

The council insisted that all sites in the Local Plan must be “deliverable”.  However, this is misleading as the term “deliverable” has a special meaning in planning terms and only applies to the first five years of the plan when it is submitted.  Beyond five years sites only have to be “developable”.

We have previously posted that there are loads of mistakes in the SHLAA that have the effect of reducing the apparent brownfield capacity and the density assumptions that Hart uses are far below what they themselves say would be achievable in urban areas.

If Hart were to include “developable” sites such as the vacant and derelict offices, Bramshill House, Pyestock (aka Hartland Park) and Sun Park as potential sites and increase the density assumptions then it is entirely possible that the whole of our remaining housing requirement could be met by brownfield development.

Surely any credible “brownfield first” strategy should include as its starting point a register of all the redundant brownfield sites in the district.

If you would like to join the campaign to get Hart to think again, then please sign and share our petition:


Go to Petition


NPPF Definition of Deliverable:

“to be considered deliverable, sites should be available now, offer a suitable location for development now, and be achievable with a realistic prospect that housing will be delivered on the site within five years and in particular that development of the site is viable”

NPPF Definition of Developable:

“to be considered developable, sites should be in a suitable location for housing development and there should be a reasonable prospect that the site is available and could be viably developed at the point envisaged”


Rushmoor’s Employment Land Review has errors that reduce brownfield site availability

Vacant Block at Ancells Farm, Fleet, Hart District, Hampshire

Vacant Block at Ancells Farm, Fleet, Hart District, Hampshire

Rushmoor Borough Council has produced a draft Employment Land Review (ELR) on behalf of Hart District Council, Surrey Heath and Rushmoor.  We Heart Hart has examined this draft document and found some serious errors in the way they have calculated both the historic jobs growth numbers and the future jobs projections for the area. Moreover, after discounting the Experian methodology for calculating future jobs growth saying:

“Experian-derived forecasts which are considered unreliably high in that they make too many assumptions around unconstrained economic growth”,

they recommend that the scenario that is used for testing should be based on the numbers for housing development contained in the SHMA, which themselves are inflated by the self same Experian forecasts they earlier dismissed as unreliable. This is clearly an absurd position that results in the forward B-class job projections (598 per annum) being nearly double the rate (300 per annum) that would be achieved if we continued at the rate of growth that was delivered between 1998 and 2012.  The impact of this is that the amount of employment land we need is being over-stated and so reducing the amount of brownfield land that might be available for housing.  This represents a great opportunity for Hart Council to challenge Rushmoor to re-visit the ELR and revise it so that more brownfield land comes available across the three districts.

We have asked several questions about the errors we found, but have not received satisfactory responses. We urge you to contact your councillors and ask them to challenge Rushmoor to come up with more realistic estimates and revise the ELR before it becomes final and sign our petition:


Go to Petition


The detail of the analysis is shown below.

ELR Table 8.2

ELR Table 8.2

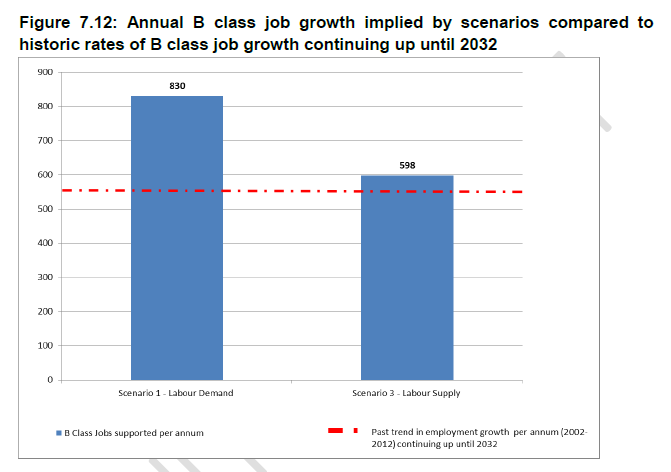
The starting point for the analysis is Table 8.2 that shows the forecast employment change in a number of different types of jobs, from which it is possible to derive the ratio of B-Class jobs to all jobs at 53% (17,428/32,906). B-Class jobs means those jobs that require office space or light industrial units, rather than an indication that they are somehow inferior.  Then we must look at Figure 7.12 that allegedly compares the historic rate of growth of B-Class jobs to the forward projections.

Figure 7.12 ELR

Figure 7.12 ELR

By inspection, Figure 7.12 shows the trend in B-Class jobs as approx 555 per annum from 2002-2012.  The data from Table 8.2 allows us to derive total job growth of around 1,048 per annum.  However, as we shall show below, this number is far in excess of the actual job growth achieved according to the SHMA.

The SHMA contains data on the historic rates of job growth.  This shows two sets of data that are derived from different sources and cover different time periods (Figures 4.3 & 4.4 of the SHMA).

First, there is the period 1998-2008, covered by ABI data.  This shows overall job growth in the period of 7,200, or 720 per annum for the 10 year period with a compound annual growth rate (CAGR) of 0.6%.  This would equate to a growth rate of B-Class jobs of 382 per annum, far lower than the 555 jobs per annum shown in figure 7.12.

Second there are different BRES sourced data for the periods of 2009-2012. The BRES data from 2009-2012 shows total jobs growth of 200, or 67 per annum (35 B-Class per annum) for the 3 years in question or a CAGR of 0.05%, again far lower than the 555 in figure 7.12.  It is difficult to see how the 555 number was derived since it is much higher than either period covered in the SHMA.  Despite repeated questions, no one has been able to explain how they derived their number for Figure 7.12.

Comparison of the BRES data and the ABI data shows a discontinuity between 2008 and 2009, with a jobs increase of nearly 10,000 when we know the economy was in the teeth of a deep recession. Note that the report states that the ABI and BRES data cannot be directly compared because they are compiled using different methods. It is therefore clear that each period (and dataset) should be treated separately and independently rather than splicing them together.

Treating the datasets separately would indicate total jobs growth over the economic cycle of 7,400, or 529 per annum or a CAGR of 0.41%, based on backward extrapolation of the BRES data.  This would equate to B-Class jobs growth rate of 280 per annum, or about half the number in Figure 7.12 of the ELR.

Taking the 0.41% rate of growth as a future projection would mean we would add 11,332 overall jobs over the period of 2012-2032 at an average rate of 567 total jobs per annum, or 300 B-Class jobs per annum.

However, the scenario recommended for testing in the ELR assumes a rate of B-Class jobs growth of 598 per annum (or total jobs growth of 1,128 per annum), nearly double the rate that would represent a forward projection of past performance over the economic cycle.  Incidentally, this is almost the same number as the future jobs growth number contained in the SHMA, which is based on the same Experian forecasts that the ELR itself discredits.