Last week, we tabled six infrastructure questions to be answered at tonight’s council meeting. We found out last night that five of them won’t be answered for dubious reasons. We think this behaviour form the council is dangerously authoritarian. Our questions (in bold), Hart’s reasoning, and our response (in red) are shown below.
In essence, it seems that the CCH/Lib Dem administration does not want to face facts about school and infrastructure provision. This is frankly pathetic, and does not bode well for the quality of the next version of the Local Plan that is due to be published before Christmas, in preparation for a Cabinet meeting in early January.
Infrastructure Questions – Schools
Q1: Hampshire County Council have recently published a school places plan that shows a surplus of secondary school places up to 2021. There is now extra space for expanding Calthorpe Park. Would a new secondary school be required if the Local Plan was based on:
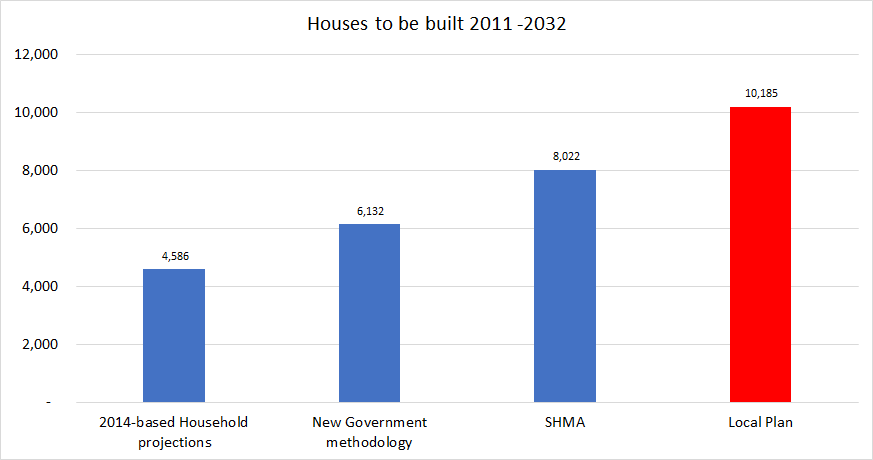
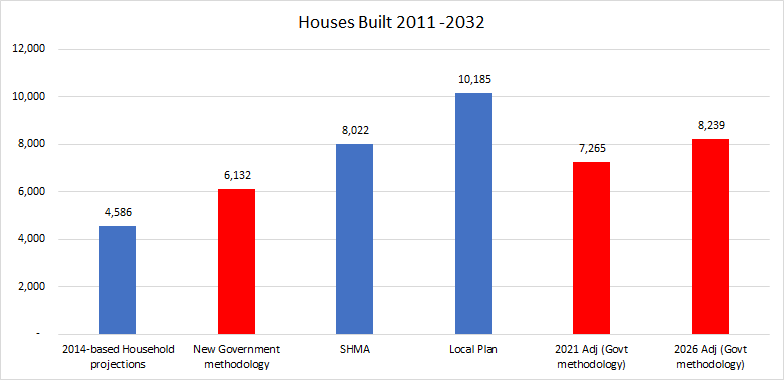
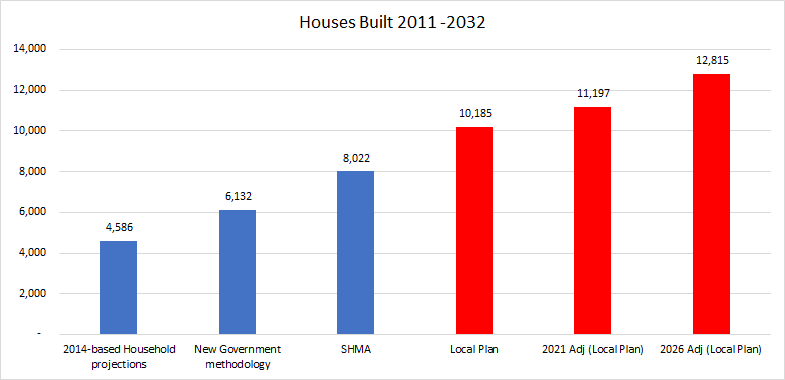
- The 10,185 units in the draft Local Plan?
- The 8,022 units in the SHMA?
- The 6,132 units (or ~6,500 if Hart needs to build some extra for Surrey Heath) implied by the recent Government consultation on the approach to calculating housing need?
Notwithstanding the fact that the question is badly framed because it seeks to compare a short term School Places Plan with a much longer Local Plan which would run to 2032 (therefore there is no possibility of a genuine comparison), Hampshire County Council has a statutory duty to ensure a sufficiency of school places for Hampshire children. Therefore the hypothetical question set out in the question about the need for a secondary school should be put to Hampshire County Council as Hart District Council is not promoting a new secondary school other than working with Hampshire County Council to secure the long term availability of land for a possible future secondary school.
We are therefore rejecting the question as it relates to a matter for Hampshire County Council and also the answer will not inform any current decisions or scenarios that are being considered by Hart District Council.
The question will not be put to Council on Thursday.
For background information Hampshire County Council made comments in respect of 10,185 units. These can be viewed on the Council’s web site at: https://www.hart.gov.uk/sites/default/files/4_The_Council/Policies_and_published_documents/Planning_policy/Local_Plan/EM143%20-%20Hampshire%20County%20Council.pdf
Given the Government has published new guidance on how to calculate housing need, we think it is perfectly reasonable to ask questions about how that will impact school place planning. We wish that HCC had done pupil forecasting beyond 2021, but they haven’t. We were not comparing HCC’s time horizon with the Local Plan period, merely noting that up to 2021, no new secondary school is required. The purpose of the question was to find out if this would remain the case up to 2032 under a range of housing target scenarios. We think this analysis is crucial to creating a sound Local Plan.
Q2: The school places plan also shows continuing pressure on Fleet schools. Given that there is significant development proposed at Sun Park and Hartland Village, have you considered siting a new secondary school, if required, at Hartland Village or using part of the Bramshot Farm SANG?
Apparently, this question will be answered tomorrow.
Q3: HCC has also published an Infrastructure Statement showing the cost of a 150-pupil expansion of Robert Mays to be £7.6m. Scaling this up, a 9-form entry secondary school at Murrell Green or Winchfield would cost ~£68m. The expected developer funding from an 1,800 unit development with 40% affordable would be around £16m. How do you propose to fund the remaining budget for the school plus necessary the road improvements and community infrastructure?
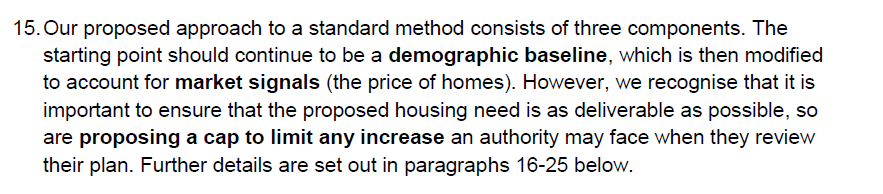
Hampshire County Council has a statutory duty to ensure a sufficiency of school places for Hampshire children. The scenario presented in Q3 about education costs is based upon speculation that does not reflect true costings (benchmarking costs as published on Hampshire County Council’s web site at http://documents.hants.gov.uk/education/NationalSchoolDeliveryCostBenchmarking-PrimarySecondarySENSc.pdf).
(It will confirm that the scenario of £68m is quite unrealistic)
We have checked this source, and they are quite right, using the median estimate per pupil, a 9-form entry, 1,350 pupil school would cost around £27.3m. However, this is somewhat below Hart’s/HCC’s own assessment in July 2015, of £56-60m. So, we don’t think our £68m estimate is out of the ballpark, given it is based on more recent budget numbers for a school extension. In any event, this is not a reason to refuse to answer the question.
In any event, the question is badly framed. It is not a proper question to put to Council as it is more of a hypothetical and speculative debating point. It starts with a false premise about secondary school cost (£68m for a secondary school that is not being promoted through the emerging Local Plan) and then goes on to make uninformed speculative statements on developer funding and cost without any supporting evidence base. The suggested conclusion is not logical either. The published facts confirm that for Murrell Green for example, the development will, in addition to its own infrastructure costs, deliver 40% affordable homes, £34.5m in S106 contributions, and still leave the developer a healthy and viable surplus.
A new school was certainly being promoted in the draft Local Plan, so we feel the question is entirely reasonable. The estimate of £34.5m S106 contributions for Murrell Green is entirely new to us. We based our calculation as follows. 1,800 units in total, 40% affordable leaves 1,080 units available to make contributions, of around £14,800 per unit. At an average price of £500,000 this would mean arond 3% of revenues, or around 20% of estimated net margin of 15% of selling price. Hart’s estimate of £34.5m assumes £32,000 per unit that sounds on the high side to us.
The next version of the Local Plan at formal Regulation 19 Publication stage will show how much housing we are planning for and where it is going. The accompanying infrastructure plan to support the development proposed will be published alongside it.
The Chairman is, therefore, rejecting the question for the above reasons as we consider that the preparation of an answer to such hypothetical and speculative scenarios would require a disproportionate amount of time, money, and effort in circumstances where the work required to answer the question would not inform any decisions to be made by the Council.
We don’t think it is at all hypothetical to ask about how our infrastructure will be funded. Indeed, James Radley has recently gone on the record calling for an “infrastructure led” Local Plan, which makes our questioning even more relevant.
The question will not be put to Council on Thursday.
Infrastructure Questions – Overall Funding
Q4: The same Infrastructure Statement showed an overall funding gap of £72m for Hart. The figures don’t include healthcare, extra-care places for the elderly nor countryside services. How do you propose to quantify the un-costed items and to close the funding gap?
The question again is badly framed and fundamentally mis-quotes the purpose of Hampshire’s Infrastructure Statement. It also confuses matters that are not infrastructure funding or relevant to funding from new development.
We have not misquoted Hampshire’s document. OUr report about it, and relevant images from the document can be found here. All of the elements in our question are in Hampshire’s statement. It is entirely reasonable to ask how the funding gap will be closed, whether through development or other means.
For the record, the HCC Infrastructure Statement set out the requirements identified to support growth, but it does not attempt to set priorities with regard to funding. The Statement also specifically recognises that local authorities cannot require developers to fund existing deficiencies in infrastructure provision.
We never said it did.
In this regard, there is no expectation that development in Hart or any other District should seek to meet the overall funding gap as identified in the Infrastructure Statement (because much of the infrastructure deficit is historic) but infrastructure funding will be required to mitigate the adverse effects arising from the development itself.
We shall have to agree to disagree. When the Deputy Leader goes on the record calling for an ‘infrastructure led’ Local Plan, then it does set an expectation that our creaking infrastructure will be fixed. The reason why we have an historic funding deficit is continued mismanagement and inability to focus on getting infrastructure right. It seems by refusing to answer questions about it, the council is going to continue in the same vein. Continuing to do the same thing whilst expecting a different result is the definition of stupidity.
The next version of the Local Plan at formal Regulation 19 Publication stage will show how much housing we are planning for and where it is going. The accompanying infrastructure plan to support that development will be published alongside it.
The Chairman is, therefore, rejecting the question for the above reasons as we consider that the preparation of an answer to such hypothetical and speculative scenarios would require a disproportionate amount of time, money, and effort in circumstances where the work required to answer the question will would not inform any decisions to be made by the Council.
The question will not be put to Council on Thursday.
Infrastructure Questions – Alternative Scenarios
Q5: What is the expected incremental infrastructure funding requirement and contribution from developers if you were to construct the Local Plan based on:
- The 10,185 units in the draft Local Plan?
- The 8,022 units in the SHMA?
- The 6,132 units (or ~6,500 if Hart needs to build some extra for Surrey Heath) implied by the recent Government consultation on the approach to calculating housing need?
This question is based upon retrospective or hypothetical scenarios that are not being advanced by the Council. These again are debating points and not a proper question to be put to Council. In any event, the next version of the Local Plan at formal Regulation 19 Publication stage will show how much housing we are planning for and where it is going. The accompanying infrastructure plan to support development in the Local Plan will be published alongside it.
These are not hypothetical scenarios. The draft Local Plan called for 10,185 new houses. THe SHMA came up with 8,022. The consequence of the new Government consultation on housing need is 6,132 units. It is perfectly reasonable to expect the council to do some strategic scenario planning to calculate the different costs and contributions to infrastructure that might be expected under each scenario and make decisions accordingly.
The Chairman is therefore, rejecting the question for the above reasons as we consider that the preparation of an answer to such hypothetical and speculative scenarios would require a disproportionate amount of time, money, and effort in circumstances where the work required to answer the question will would not inform any decisions to be made by the Council.
We asked the question because we thought they would have already done this work. It is fundamental to the decision-making process.
The question will not be put to Council on Thursday.
Pathetic.
Q6: Which of the above options would result in the lowest infrastructure funding gap?
This question is based upon hypothetical scenarios that are not being advanced by the Council. These again are debating points and not a proper question to be put to Council. In any event, the next version of the Local Plan at formal Regulation 19 Publication stage will show how much housing we are planning for and where it is going. The accompanying infrastructure plan to support the Local Plan proposals will be published alongside it.
No, it is asking for a conclusion, based on the previous question. I think we all know that we will end up with a lower infrastructure funding gap if we go with a lower housing number. The council has a duty to at the very least consider this and make decisions based on sound data and information. And we as residents should expect no less from our elected representatives.
The Chairman is, therefore, rejecting the question for the above reasons as we consider that the preparation of an answer to such hypothetical and speculative scenarios would require a disproportionate amount of time, money, and effort in circumstances where the work required to answer the question will would not inform any decisions to be made by the Council.
The question will not be put to Council on Thursday.