![]()
As we reported here, a number of developers have put forward the idea that Hart District’s Local Plan housing target should be double that in the current housing market assessment. We have been through Barratt Homes‘ document and come to the conclusion that it is a load of tendentious nonsense.
In this post we demolish their main arguments. Let us remember that Barratt Developments are behind the proposals for a new town at Winchfield and have a vested interest in putting forward the highest housing target they can. But as we shall see below, they really are simply thinking of a number and tripling it.
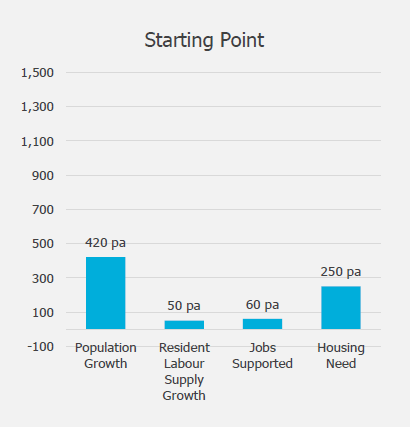
The Starting Point
They start innocuously enough, with the latest 2012-based population projections, leading to a starting point of 250 dwellings per annum, or a target of around 5,000 houses, somewhat less than the current SHMA figure of 7,534. Note that if this 5,000 number was used as our housing target, we would be able to meet our remaining housing target from windfalls and a few brownfield sites, and wouldn’t even need to redevelop Pyestock until after 2032.
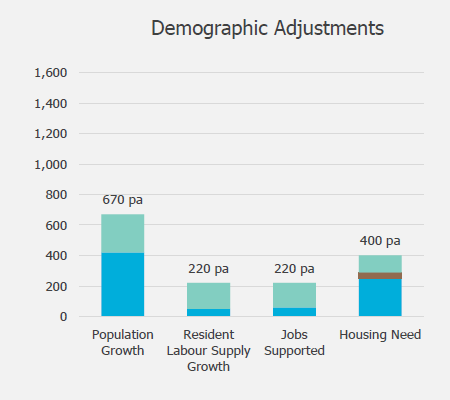
Demographic Adjustments
However, they go on to say that the starting point should be ‘adjusted’ to allow for higher household formation rates (HFR) and more inward migration.
![]()
We would probably agree that some small adjustment needs to be made for HFR. However they argue that the 2008-based Government figures are somehow more accurate than the latest 2012-based figures. But the 2008-based forecasts were proven wrong by the actual census data in 2011, and even the 2011-based figures reverse the most recent trend towards slightly larger households.
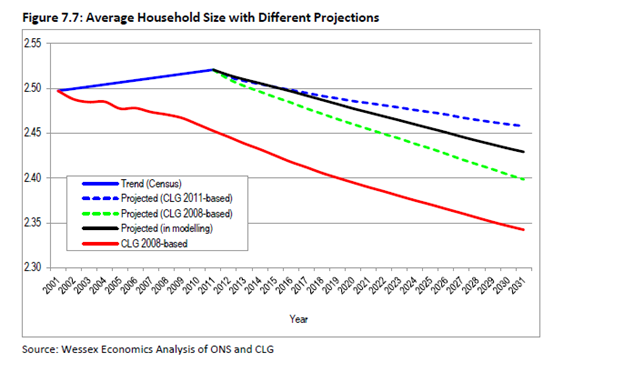
Average Household Size projections for Housing Market Area
But we really take issue with their logic on needing to take account of bigger inward migration to Hart from other districts. They appear to argue that because the 2012-based population projections are lower than the 2008-based projections, they simply must be wrong and need to be adjusted. They are arguing that because we built a lot of housing in the period 2003-2007, and created a great deal of housing supply, so inward migration increased, then we need to do that each and every year from 2011-2031. They also suggest that Government’s population projections don’t include enough allowance for immigration to the country. Let’s deal with their arguments:
First, the Government central projections already assume net immigration to the country of 185,000 per year out to 2039, nearly twice the Government’s target of 10’s of thousands, so we would argue that so migration from abroad is already in the starting point.
Second, by definition, migration from other parts of the UK, must be unmet need from other areas. But every area has to follow the National Planning Policy Framework and meet the needs of their local district, so where is this extra internal migration going to come from? As we have shown before, our analysis of five other housing needs assessments of planning authorities across Hampshire, Oxfordshire, Surrey and Berkshire reveals an average housing uplift on the baseline population projections of around 42%. It simply cannot be right for every district to be assuming that they need to make an uplift to their housing targets because of inward migration from other districts, or we will end up with far more houses than we need.
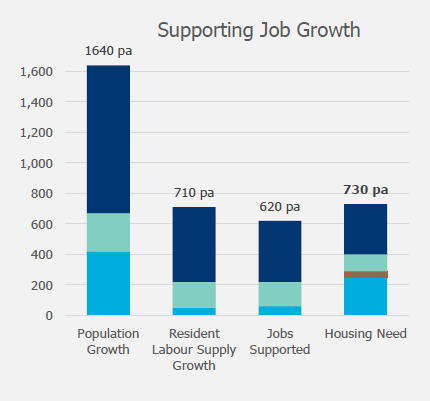
Jobs Growth Adjustments
Barratts then go on to quote the average of three jobs forecasts that say that Hart District can and should produce jobs at a rate of 620 per annum, or 1,650 per annum across the whole Housing Market Area (HMA) that includes Rushmoor and Surrey Heath.
![]()
This job creation rate for the HMA is higher than in the current SHMA (1,130 jobs per annum), which represents a near doubling of the job creation rate achieved in the period 1998-2012 and significantly higher than the 414 jobs per annum created in the same period for Hart District.
They then conclude that we need to build 730 houses per annum to meet these jobs forecasts, nearly three times the starting point of the population projections. They have literally taken the official Government projections and tripled them for no sound reason.
Of course, they then go on to say that we will need to have an even higher population in Hart, created by even more net migration to do the jobs in the forecasts. But they don’t explain where this population is going to come from. Again, if overseas immigration is already factored into the Government population forecasts, and this even higher rate of population growth in Hart would have to be people from other districts, and those other districts are duty bound to meet the needs of their own people.
Elsewhere in the report, Barratts say that only 45% of Hart’s workforce work in Hart. Surely, if all these jobs were going to materialise in the district, more of the workforce would choose to work closer to where they live and we wouldn’t need more inward migration, and so our housing requirement would fall?
Their approach appears to be against the latest advice from the Planning Advisory Service which states that housing need should be “principally understood as a measure of future demand rather than aspiration”. Employment in the district should be a matter for consultation (see Peter Village QC opinion), and in any case a high level of jobs growth that requires more inward migration is by definition meeting the unmet needs of other districts and an ‘aspiration’ which is contrary to planning advice.
Affordable Housing
They then go on to claim that if we built 730 dwellings per annum, and affordable housing at the 40% rate in current policy we would deliver almost all of the affordable housing we need. But to support this claim, they say that Hart’s evidence base says we need 320 affordable houses per annum. This is four times the current SHMA (Figure 8.4) that says we need 79 affordable houses per annum, plus a few more intermediate houses.
All in all this report from Barratts is self serving, tendentious nonsense that should be dismissed out of hand.