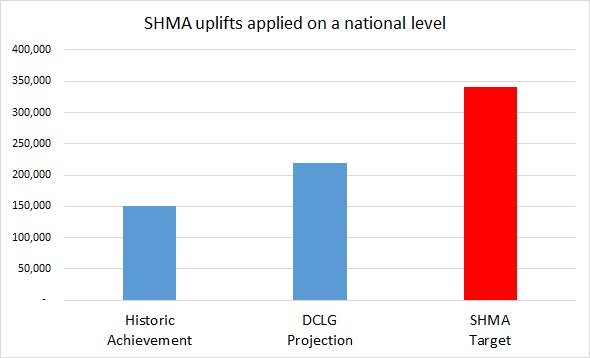
Figure 1: Hart Surrey Heath and Rushmoor SHMA adjustments applied at national level
Evidence presented at the examination of the Vale of the White Horse Local Plan has demonstrated that if the adjustments made to the baseline DCLG housing projections were applied on a national basis, they would increase the national output of housing to double the DCLG estimate of what is needed and triple the recent output of housing.
Applying a similar approach to the Hart, Rushmoor and Surrey Heath SHMA shows that on a national basis, we would be delivering 54% more housing than we need on a national basis, see Figure 1 above. Surely it cannot be right that we are being asked to build at a rate that would lead to a surplus of housing.
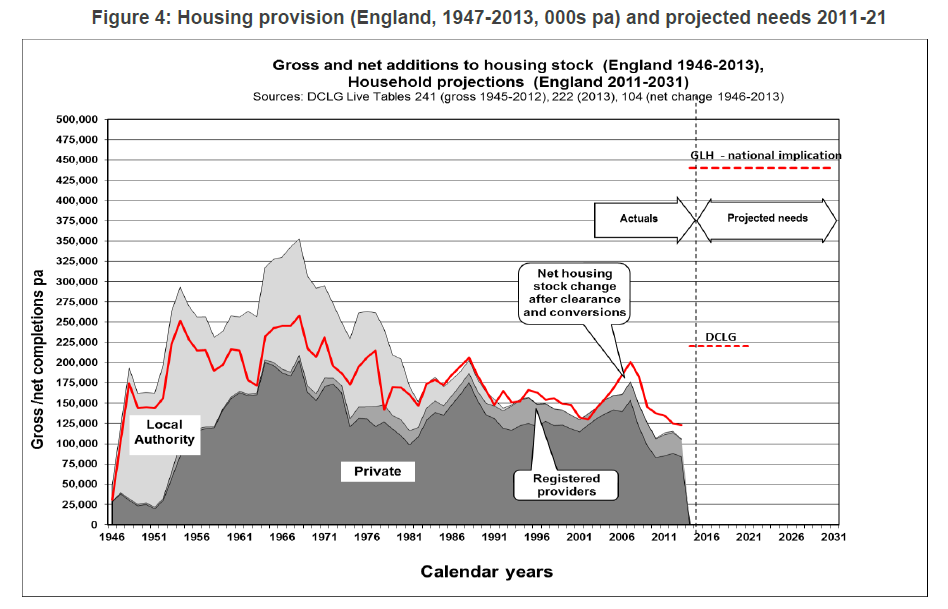
Figure 2: England housing delivery actuals and projected 1946-2031
The baseline DCLG projections for the combination of Hart, Surrey Heath and Rushmoor call for 790 houses per annum (SHMA Figure 7.3). This equates to the DCLG projection of 220,000 houses per annum nationally (see figure 2 above). This compares to recent performance of around 150,000 houses per annum.
The final SHMA, after taking into account past under-delivery, amount to a total of 24,413 houses (see table below), or an increase of 54.6% over the DCLG baseline figures. The duty to cooperate might mean that Hart District has to build more houses than either Surrey Heath or Rushmoor as part of our Local Plan.
| Hart District | Surrey Heath Borough | Rushmoor Borough | Total Housing Market Area | |
|---|---|---|---|---|
| Original SHMA | 7,534 | 7,057 | 9,822 | 24,413 |
| Proposed Transfers | 3,022 | (1,400) | (1,622) | 0 |
| New Total | 10,556 | 5,657 | 8,200 | 24,413 |
If the same 54.6% uplift were applied to the DCLG projection, we would be building over 340,000 houses per annum nationally, more than double recent performance.
In recent years Hart has built more houses than it has been required to do and built at a rate above regional and national averages (SHMA Table 5.11). It is beginning to look like the total of the local SHMAs are much larger than the overall requirement as defined by the DCLG. Surely it cannot be right that we are being asked to build at rate more than 50% higher than the DCLG suggests we need to meet overall demand.